- Аналитика
- Технический Анализ
AUD/CHF Технический Анализ - AUD/CHF Трейдинг: 2021-10-13
AUD/CHF Сводка Технического Анализа
выше 0,686
Buy Stop
ниже 0,663
Stop Loss
| Индикатор | Сигнал |
| RSI | Нейтральный |
| MACD | Нейтральный |
| MA(200) | Купить |
| Fractals | Купить |
| Parabolic SAR | Купить |
| Bollinger Bands | Купить |
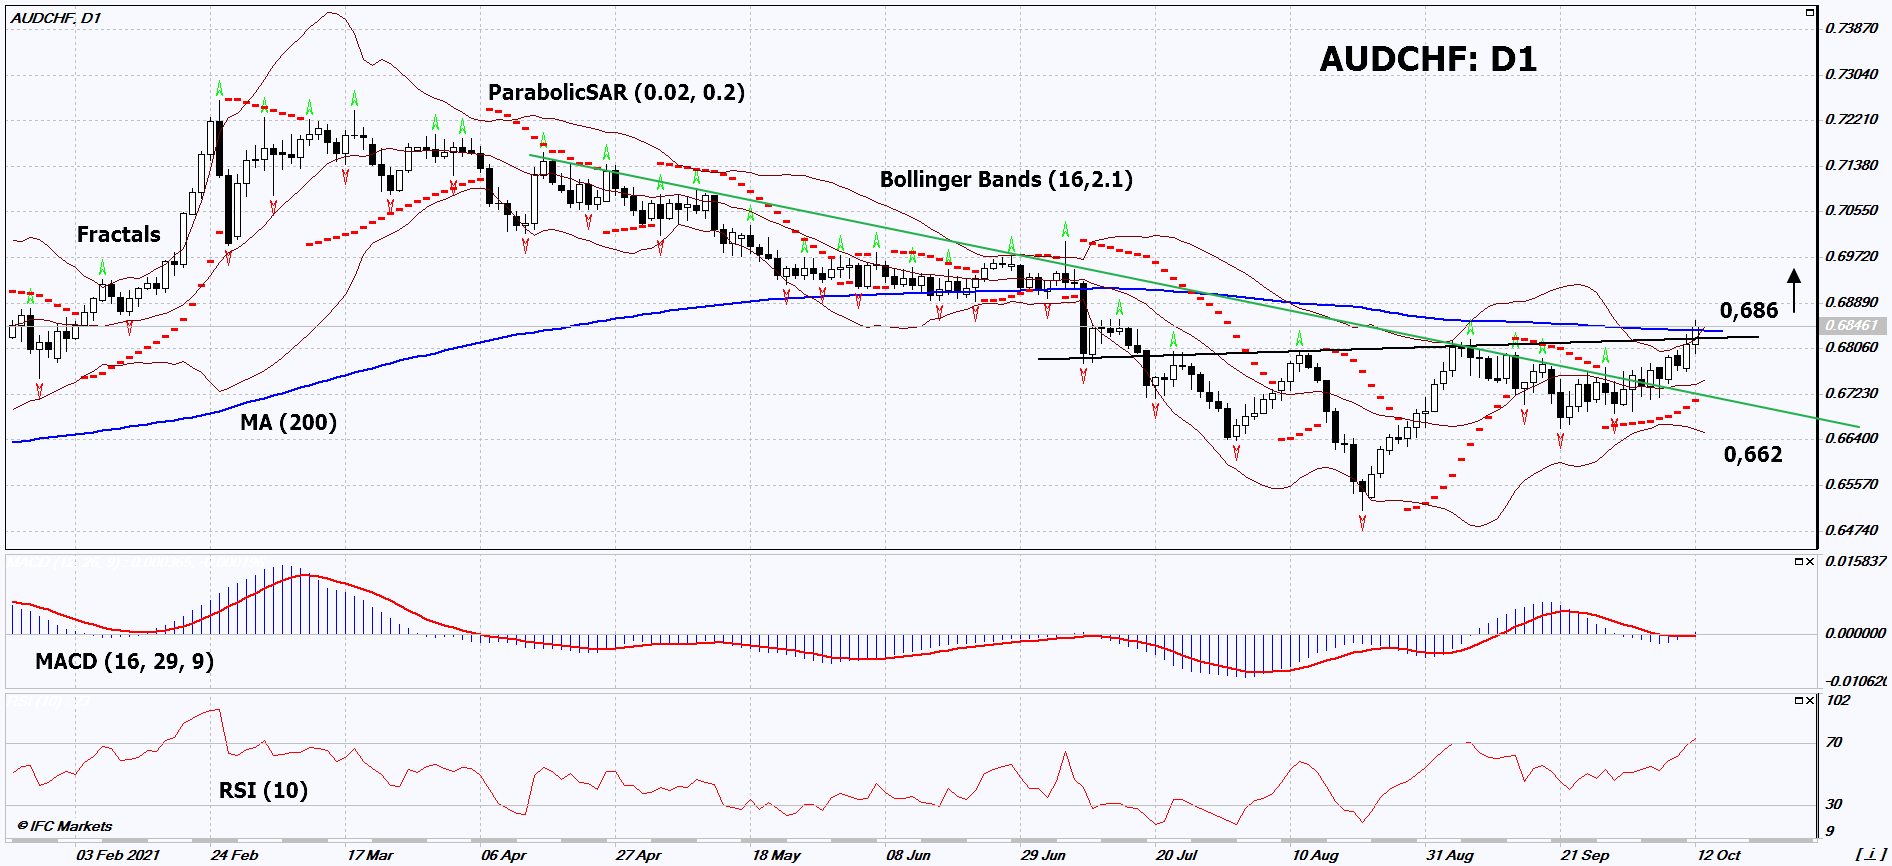
AUD/CHF Графический анализ
AUD/CHF Технический анализ
On the daily timeframe, AUDCHF: D1 broke up the downtrend resistance line and exited the inverted Head & Shoulders pattern. A number of technical analysis indicators have generated signals for further growth. We do not rule out a bullish movement if AUDCHF rises above its latest high, 200-day moving average and upper Bollinger band: 0.686. This level can be used as an entry point. The initial risk limitation is possible below the Parabolic signal, the lower Bollinger band and the last two lower fractals: 0.662. After opening a pending order, move the stop to the next fractal low following the Bollinger and Parabolic signals. Thus, we change the potential profit/loss ratio in our favor. The most cautious traders, after making a deal, can go to the four-hour chart and set a stop-loss, moving it in the direction of movement. If the price overcomes the stop level (0.662) without activating the order (0.686), it is recommended to delete the order: there are internal changes in the market that were not taken into account.
Фундаментальный Анализ Форекс - AUD/CHF
In Australia, positive economic indicators came out. Will the AUDCHF quotes continue to rise?
The upward movement signifies strengthening of the Australian dollar against the Swiss franc. The business confidence index (NAB Business Confidence) in September this year in Australia amounted to +13 points, which is higher than the forecast of -6. In August, it was -5. Several positive Australian economic indicators were released last week. In general, high world prices for coal, natural gas, non-ferrous metals and iron ore are contributing to economic growth in this country. The products of the mining and metallurgical industries in Australia account for 38% of exports and hydrocarbons - even more than 20%. All of this can contribute to the strengthening of the Australian dollar. This week in Australia, on Thursday, will be published important data on the labor market for September. Producer & Import Prices are due in Switzerland on Thursday.
Узнайте наши
условия торговли
- Спреды от 0.0 пункта
- 30 000+ торговых инструментов
- Уровень Стоп-аут — всего 10%
Готовы начать?
Открыть счёт Примечание:
Этот обзор носит исключительно информационно-познавательный характер и публикуется бесплатно. Все данные, содержащиеся в обзоре, получены из открытых источников, признаваемых более-менее достоверными. При этом не существует никаких гарантий, что указанная информация является полной и точной. В дальнейшем обзоры не обновляются. Вся информация в каждом обзоре, включая мнения, показатели, графики и всё остальное, предоставлена только в целях ознакомления, и не является финансовым советом или рекомендацией. Весь текст и его любую часть, а также графики нельзя рассматривать в качестве предложения совершать какие-либо сделки с любыми активами. Компания IFC Markets и её сотрудники ни при каких обстоятельствах не несут никакой ответственности за любые действия предпринятые кем бы то ни было после или в ходе ознакомления с обзором.

