- Аналитика
- Технический Анализ
LTCUSD Технический Анализ - LTCUSD Трейдинг: 2025-06-30
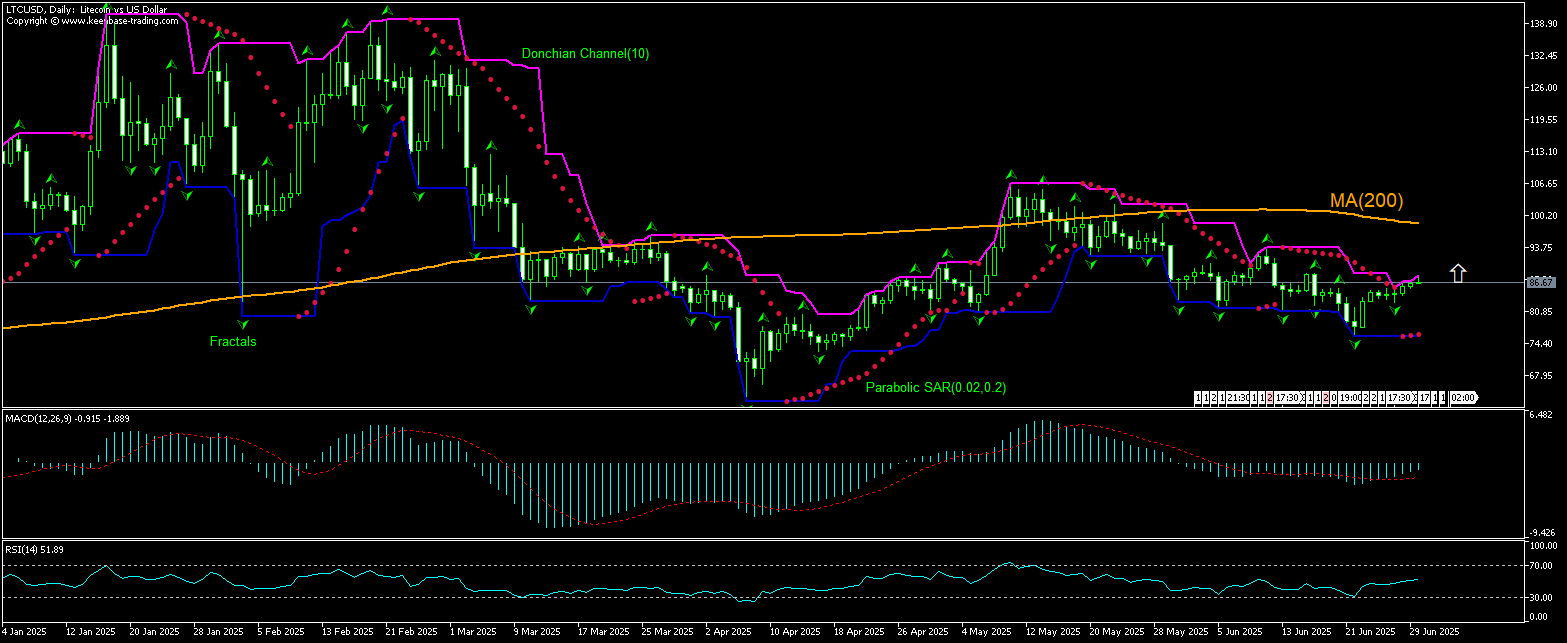
LTCUSD Сводка Технического Анализа
выше 88.09
Buy Stop
ниже 91.39
Stop Loss
| Индикатор | Сигнал |
| RSI | Нейтральный |
| MACD | Купить |
| MA(200) | Продать |
| Fractals | Купить |
| Parabolic SAR | Купить |
LTCUSD Графический анализ
LTCUSD Технический анализ
The LTCUSD technical analysis of the price chart on daily timeframe shows LTCUSD,Daily is rebounding toward the 200-period moving average MA(200) after hitting 9-week low eight days ago. We believe the bullish momentum will continue after the price breaches above the upper boundary of Donchian channel at 88.09. A level above this can be used as an entry point for placing a pending order to buy. The stop loss can be placed below 81.39. After placing the order, the stop loss is to be moved to the next fractal low , following Parabolic indicator signals. Thus, we are changing the expected profit/loss ratio to the breakeven point. If the price meets the stop loss level without reaching the order, we recommend cancelling the order: the market has undergone internal changes which were not taken into account.
Фундаментальный Анализ Крипто - LTCUSD
LTCUSD is attempting a rebound as traders bet on LTC ETF approval. Will the LTCUSD price rebound continue?
Litecoin (LTC) rose almost 9% last week as traders anticipate a regulatory boost: the U.S. Securities and Exchange Commission is reviewing two bids for a spot Litecoin ETF. Couple of weeks ago Bloomberg analyst Seyffart estimated the chances for a Litecoin spot ETF being greenlighted this year stand at 90%. Polymarket traders assign an 83% chance to SEC approval of a LTC ETF this year. A green light to such a fund this year would open LTC exposure to investors betting on crypto through traditional brokerages. Expectations of a LTC ETF approval by SEC are bullish for LTCUSD price.
Узнайте Наши
Условия Торговли
- Спреды от 0.0 пункта
- 30 000+ торговых инструментов
- Мгновенное исполнение
Готовы начать?
Открыть счёт Примечание:
Этот обзор носит исключительно информационно-познавательный характер и публикуется бесплатно. Все данные, содержащиеся в обзоре, получены из открытых источников, признаваемых более-менее достоверными. При этом не существует никаких гарантий, что указанная информация является полной и точной. В дальнейшем обзоры не обновляются. Вся информация в каждом обзоре, включая мнения, показатели, графики и всё остальное, предоставлена только в целях ознакомления, и не является финансовым советом или рекомендацией. Весь текст и его любую часть, а также графики нельзя рассматривать в качестве предложения совершать какие-либо сделки с любыми активами. Компания IFC Markets и её сотрудники ни при каких обстоятельствах не несут никакой ответственности за любые действия предпринятые кем бы то ни было после или в ходе ознакомления с обзором.

