- マーケット分析
- テクニカル分析
AUD/USD テクニカル分析 - AUD/USD 取引:2015-05-05
RBA rate cut
Today we examine the Aussie chart AUDUSD as a significant fundamental event happened yesterday: the Reserve Bank of Australia cut the rate from 2.25% down to 2%, as expected by market participants. Earlier the Australian dollar was weakening for four straight trading sessions, but today it has risen strongly despite the lowered rate. An old trader’s saying “buy the rumor, sell the news” worked out. Most investors explain such currency activity with the supposition that the next rate cut will happen in a very remote future. As the Australian Q1 CPI was only 1.3%, in theory, Aussie considering the current rate of 2% might be quite attractive.
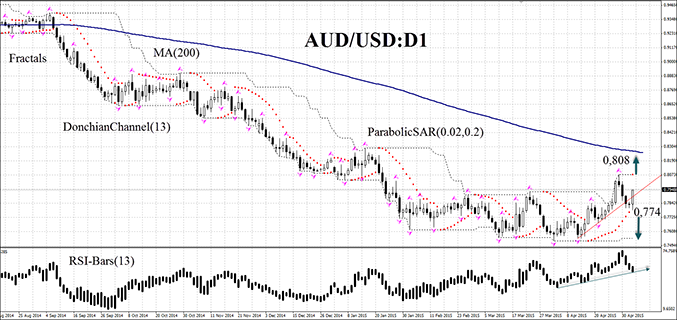
The AUD/USD:D1 is trying slowly to rebound after falling almost 28% over the past two years. It reversed upwards after being traded sideways for three months. Thereafter, the AUD/USD currency pair dropped on expectations of falling rates and returned once again to the upper boundary of the range. RSI-Bars oscillator indicates the uptrend. Its last bars reached overbought zone and then pulled back. The downward bias of the moving average (200) is decreasing. In our opinion, the momentum might be formed after the price growth and overcoming the upper Donchian Channel border and the last fractal high at 0.808 or, in case of price falling below the last Parabolic point at 0.774. Let the market choose the price movement scenario. Two or more pending orders may be placed symmetrically: when one of them is activated, the other can be canceled, since the market has chosen the direction. After pending order placing, Stop loss is to be moved every four hours near the next fractal high (short position) or fractal low (long position), following Parabolic signals. The most careful traders can switch to the H4 timeframe after order execution, placing Stop loss and moving it according to the price direction. Thus, we are changing the probable profit/loss ratio to the breakeven point.
| Position | Sell |
| Sell stop | below 0.774 |
| Stop loss | above 0.808 |
| Position | Buy |
| Buy stop | above 0.808 |
| Stop loss | below 0.774 |
- コースを取って、

【重要な注意事項】:
本レポートは、当社の親会社であるアイエフシーマーケットが作成したものの邦訳です。本レポートには、当社のサービスと商品についての情報を含みますが、お客様の投資目的、財務状況、資金力にかかわらず、情報の提供のみを目的とするものであり、金融商品の勧誘、取引の推奨、売買の提案等を意図したものではありません。 本レポートは、アイエフシーマーケットが信頼できると思われる情報にもとづき作成したものですが、次の点に十分ご留意ください。アイエフシーマーケットおよび当社は、本レポートが提供する情報、分析、予測、取引戦略等の正確性、確実性、完全性、安全性等について一切の保証をしません。アイエフシーマーケットおよび当社は、本レポートを参考にした投資行動が利益を生んだり損失を回避したりすることを保証または約束あるいは言外に暗示するものではありません。アイエフシーマーケットおよび当社は、本レポートに含まれる不確実性、不正確性、不完全性、誤謬、文章上の誤り等に起因して、お客様または第三者が損害(直接的か間接的かを問いません。)を被った場合でも、一切の責任を負いません。
