- マーケット分析
- テクニカル分析
GBP/USD テクニカル分析 - GBP/USD 取引:2015-10-13
Awaiting inflation data from US and UK
The positive divergence was formed on the GBP USD live chart. Will the technical analysis signal work out stimulating the further pound growth? Let’s consider the fundamental factors we have.
The negative data from the US labor market released on October 2 pushed down the US dollar index (have a look at US dollar index historical data). Now investors strongly doubt that the Fed will hike the rates in the near future. Another contributing factor is the steadily growing US debt and budget deficit. By various estimates, the US public debt is twice as much the annual GDP. Last year the budget deficit was $353bn. With the current quite low pace of economic expansion the rate hike by 1% percentage point may widen the deficit by half. In our opinion, it should come as no surprise that the Fed is waiting for the US GDP to increase at a higher pace. The low rates policy has a negative effect on dollar. On the contrary, the Bank of England said recently that it could hike the rates ahead of the Fed decision. Now the markets principally expect it to happen in the end of the next year. The UK budget deficit totaled 40.8bn. pounds last year with the debt to GDP ratio being 90%. According to IMF, the US and UK economies will expand by 2.5% each in 2015. Theoretically, the investors’ belief that the Old Lady may raise the rates before the Fed can support the pound. Note, that the US inflation will be released on Friday, which can affect the markets. Tomorrow the inflation will be released in UK.
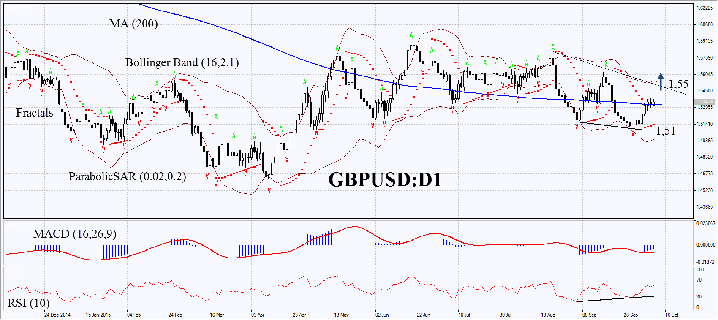
On the daily chart, the GBPUSD:D1 has surpassed the 200-day moving average. The MACD and Parabolic indicators give the signals to buy. The RSI is above 50 and has formed the positive divergence. It has not reached the overbought zone. The Bollinger Bands are contracting which may mean lower volatility. The bullish momentum may develop in case the pound surpasses the resistance at about 1.55, but the figure is changing in line with the chart. The breakout of resistance may serve the point of entry. The initial risk-limits may be placed below the Parabolic signal and the last fractal low at 1.51. The most risk-averse traders may place the stop-loss below the 200-day moving average (1.532). Having opened the pending order we shall move the stop to the next fractal low following the Parabolic and Bollinger signals every 4 hours. Thus, we are changing the probable profit/loss ratio to the breakeven point. The most risk-averse traders may switch to the 4-hour chart after the trade and place there a stop-loss moving it in the direction of the trade. If the price meets the stop-loss level of 1.51 without reaching the order of 1.55, we recommend cancelling the position: the market sustains internal changes which were not taken into account.
| Position | Buy |
| Buy stop | above 1,55 |
| Stop loss | below 1,51 or 1,532 |
【重要な注意事項】:
本レポートは、当社の親会社であるアイエフシーマーケットが作成したものの邦訳です。本レポートには、当社のサービスと商品についての情報を含みますが、お客様の投資目的、財務状況、資金力にかかわらず、情報の提供のみを目的とするものであり、金融商品の勧誘、取引の推奨、売買の提案等を意図したものではありません。 本レポートは、アイエフシーマーケットが信頼できると思われる情報にもとづき作成したものですが、次の点に十分ご留意ください。アイエフシーマーケットおよび当社は、本レポートが提供する情報、分析、予測、取引戦略等の正確性、確実性、完全性、安全性等について一切の保証をしません。アイエフシーマーケットおよび当社は、本レポートを参考にした投資行動が利益を生んだり損失を回避したりすることを保証または約束あるいは言外に暗示するものではありません。アイエフシーマーケットおよび当社は、本レポートに含まれる不確実性、不正確性、不完全性、誤謬、文章上の誤り等に起因して、お客様または第三者が損害(直接的か間接的かを問いません。)を被った場合でも、一切の責任を負いません。
