- マーケット分析
- テクニカル分析
USD/JPY テクニカル分析 - USD/JPY 取引:2015-11-23
No further monetary stimulus despite recession
On Thursday the Bank of Japan left the monetary policy unchanged with annual QE volume of 80trn yens. Moreover, other positive news came out. The RSI indicator has formed divergence on the yen chart. Will the Japanese yen continue strengthening?
Some investors have been waiting for the monetary stimulus in Japan to be expanded hoping for the further yen weakening. The Japanese economy has fallen into recession. The GDP for the 3rd quarter decreased 0.2% for the second time in a row but the monetary emission volume was not increased and yen got stronger. On its chart it is seen as the downward movement. The dynamics was supported by the October trade balance surplus of 111.5bn yen which is much better than the expected deficit of 246.3bn yen. Additional positive came from the net volume of the Japanese stocks and bonds acquired by the foreign investors climbing in a week to 573bn yens. Previous week it was 226bn yens. The next important macroeconomic data – inflation and retail sales – will come out in Japan on November 26 and 29.
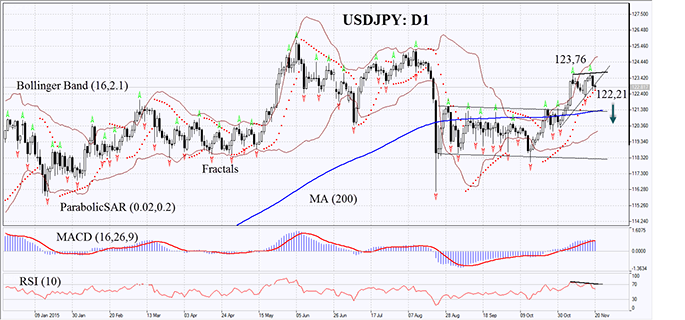
On the daily chart the USDJPY:D1 has broken down the support of the short-term uptrend. It is above its 200-day moving average. The Parabolic indicator gives sell signal while MACD just began forming the sell signal. The RSI indicator has formed the negative divergence. The Bollinger bands have severely widened which means high volatility. The further bearish trend may develop for the yen in case the Japanese currency surpasses the last fractal low at 122.21. The initial risk-limit may be placed below the last fractal high at 123.76. Having opened the pending order we shall move the stop to the next fractal high following the Bollinger and Parabolic signals every 4 hours. Thus, we are changing the probable profit/loss ratio to the breakeven point. The most risk-averse traders may switch to the 4-hour chart after the trade and place there a stop-loss moving it in the direction of the trade. If the price meets the stop-loss level of 123.76 without reaching the order of 122.21, we recommend cancelling the position: the market sustains internal changes which were not taken into account.
| Position | Sell |
| Sell stop | below 122.21 |
| Stop loss | above 123.76 |
- コースを取って、

【重要な注意事項】:
本レポートは、当社の親会社であるアイエフシーマーケットが作成したものの邦訳です。本レポートには、当社のサービスと商品についての情報を含みますが、お客様の投資目的、財務状況、資金力にかかわらず、情報の提供のみを目的とするものであり、金融商品の勧誘、取引の推奨、売買の提案等を意図したものではありません。 本レポートは、アイエフシーマーケットが信頼できると思われる情報にもとづき作成したものですが、次の点に十分ご留意ください。アイエフシーマーケットおよび当社は、本レポートが提供する情報、分析、予測、取引戦略等の正確性、確実性、完全性、安全性等について一切の保証をしません。アイエフシーマーケットおよび当社は、本レポートを参考にした投資行動が利益を生んだり損失を回避したりすることを保証または約束あるいは言外に暗示するものではありません。アイエフシーマーケットおよび当社は、本レポートに含まれる不確実性、不正確性、不完全性、誤謬、文章上の誤り等に起因して、お客様または第三者が損害(直接的か間接的かを問いません。)を被った場合でも、一切の責任を負いません。
