- Analytik
- Technische Analyse
Ethereum / USD Technische Analyse - Ethereum / USD Handel: 2025-05-26
Ethereum / USD Technical Analysis Summary
Above 2572.90
Buy Stop
Below 2533.63
Stop Loss
| Indicator | Signal |
| RSI | Neutral |
| MACD | Buy |
| Donchian Channel | Neutral |
| MA(200) | Buy |
| Fractals | Buy |
| Parabolic SAR | Buy |
Ethereum / USD Chart Analysis
Ethereum / USD Technische Analyse
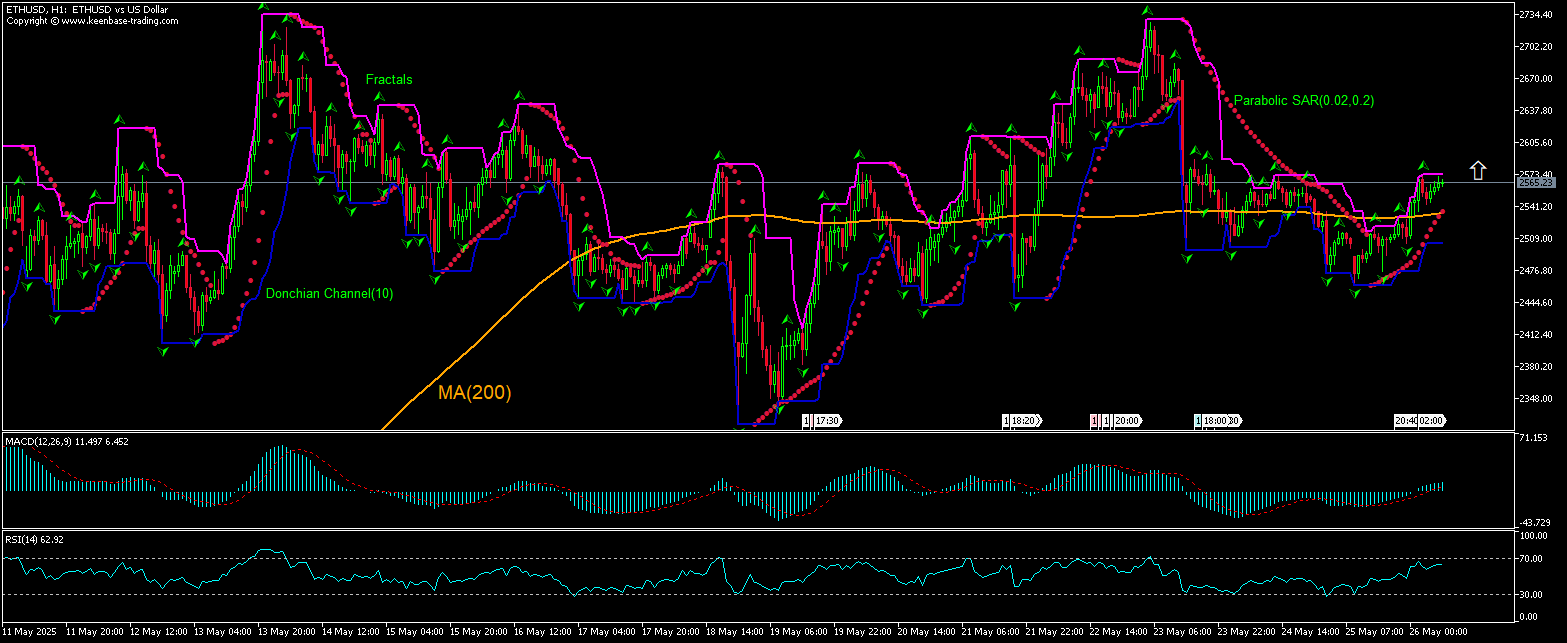
The ETHUSD technical analysis of the price chart on 1-hour timeframe shows ETHUSD: H1 is rising after breaching above the 200-period moving average MA(200) as it rebounded after a drop to five-day low yesterday. We believe the bullish momentum will continue after the price breaches above the upper bound of the Donchian channel at 2572.90. A level above this can be used as an entry point for placing a pending order to buy. The stop loss can be placed below 2533.63. After placing the order, the stop loss is to be moved to the next fractal low indicator, following Parabolic signals. Thus, we are changing the expected profit/loss ratio to the breakeven point. If the price meets the stop loss level without reaching the order, we recommend cancelling the order: the market has undergone internal changes which were not taken into account.
Fundamentale Analyse Cryptovaluta - Ethereum / USD
Ethereum prices rose as Bitcoin broke into new record territory last week. Will the ETHUSD price continue advancing?
Ethereum rose more than 40% in the last month and prices tracked Bitcoin movement as the cryptocurrency leader broke into new record territory last week. ETHUSD then retreated, unable to breach above $2734. Glassnode post on May 25 notes there is a significant cluster of investor cost basis levels around $2,800, meaning that many holders had bought at that level and were underwater for months as prices retreated from that level. And as ETHUSD approaches this level, they may see it as a chance to exit at break-even which could add significant sell-side pressure to the market. However, the current setup is bullish for ETHUSD.
Explore our
Trading Conditions
- Spreads from 0.0 pip
- 30,000+ Trading Instruments
- Instant Execution
Ready to Trade?
Open Account Hinweis:
Diese Übersicht hat einen informativen und Tutorencharakter und wird kostenlos veröffentlicht. Alle Daten, die in dieser Übersicht eingeschlossen sind, sind von mehr oder weniger zuverlässigen öffentlichen Quellen erhalten. Außerdem gibt es keine Garantie, dass die angezeigte Information voll und genau ist. Die Übersichten werden nicht aktualisiert. Die ganze Information in jeder Übersicht, einschließlich Meinungen, Hinweise, Charts und alles andere, werden nur für Vertrautmachen veröffentlicht und sind keine Finanzberatung oder Empfehlung. Der ganze Text und sein jeder Teil sowie die Charts können nicht als ein Geschäftsangebot betrachtet werden. Unter keinen Umständen sind IFC Markets und seine Angestellten für die Handlungen, die von jemand anderem während oder nach dem Lesen der Übersicht genommen werden, verantwortlich.

