- Analytics
- Technical Analysis
AUD USD Technical Analysis - AUD USD Trading: 2018-01-12
Strong economic data bullish for Australian Dollar - AUD
Retail sales and building permits in Australia were better than expected in November. Will the AUDUSD climb continue?
The Reserve Bank of Australia held the interest rate at 1.5% for the fifteenth month at its December 5 policy meeting. Australian economic data have largely been positive recently: retail sales in November were stronger than expected at 1.2% growth after 0.5% gain in October, and building permits rose 11.7% when a decline was expected. Improving data pointing to continued strength of Australian economy are bullish for AUDUSD.
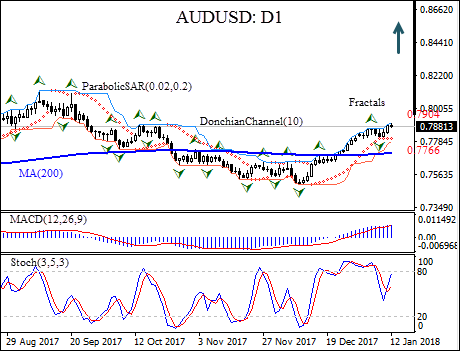
On the daily timeframe AUDUSD: D1 is retracing higher after decline following the seventeen-month high in the beginning of September. The price has risen above the 200-day moving average MA(200).
- The Donchian channel indicates uptrend: it is tilted up.
- The Parabolic indicator gives a buy signal.
- The MACD indicator is above the signal line and the gap is widening, which is a bullish signal.
- The stochastic oscillator is rising but hasn’t reached the overbought zone.
We believe the bullish momentum will continue after the price breaches above the upper Donchian bound at 0.7904. This level can be used as an entry point for placing a pending order to buy. The stop loss can be placed below the lower Donchian bound at 0.7766. After placing the order, the stop loss is to be moved every day to the next fractal low, following Parabolic signals. Thus, we are changing the probable profit/loss ratio to the breakeven point. If the price meets the stop loss level (0.7766) without reaching the order (0.7904), we recommend cancelling the order: the market has undergone internal changes which were not taken into account.
Technical Analysis Summary
| Position | Buy |
| Buy stop | Above 0.7904 |
| Stop loss | Below 0.7766 |
- Get Certificate

Note:
This overview has an informative and tutorial character and is published for free. All the data, included in the overview, are received from public sources, recognized as more or less reliable. Moreover, there is no guarantee that the indicated information is full and precise. Overviews are not updated. The whole information in each overview, including opinion, indicators, charts and anything else, is provided only for familiarization purposes and is not financial advice or а recommendation. The whole text and its any part, as well as the charts cannot be considered as an offer to make a deal with any asset. IFC Markets and its employees under any circumstances are not liable for any action taken by someone else during or after reading the overview.
