- Analytics
- Technical Analysis
GBP USD Technical Analysis - GBP USD Trading: 2018-09-06
Accelerating UK services sector and car sales bullish for GBPUSD
UK services sector expansion accelerated and car sales rose in August. Will the GBPUSD continue rising?
Recent UK economic data were positive. Markit’s Markit’s Services PMI rose from 53.5 to 54.3 in August, and new car sales in August jumped to 23.1% over the same period a year ago. Improved data followed reports that expansion in manufacturing and construction sectors slowed. Expanding services activities and sharp rise in car sales are bullish for GBPUSD.
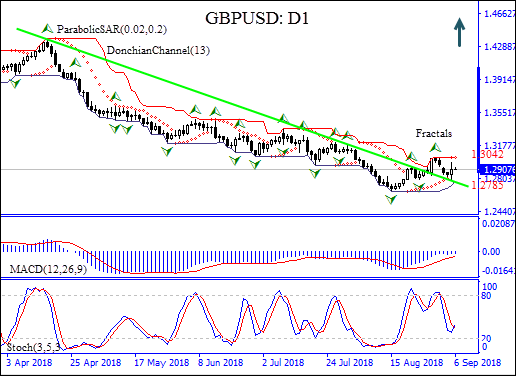
On the daily timeframe GBPUSD: D1 had been trading with negative bias after hitting twenty-six-month high in mid-April. The price has remained above the resistance line turned into support after testing it.
- The Parabolic indicator has formed a sell signal.
- The Donchian channel indicates uptrend: it tilted up.
- The MACD indicator is below the signal line with the gap narrowing. This is a bullish signal.
- The stochastic oscillator is rising but has not reached the overbought zone.
We believe a bullish momentum will continue after the price breaches above the upper Donchian boundary at 1.3042. This level can be used as an entry point for placing a pending order to buy. The stop loss can be placed below the lower Donchian channel at 1.2785. After placing the pending order the stop loss is to be moved every day to the next fractal low, following Parabolic signals. Thus, we are changing the probable profit/loss ratio to the breakeven point. If the price meets the stop-loss level (1.2785) without reaching the order (1.3042) we recommend cancelling the order: the market sustains internal changes which were not taken into account.
Technical Analysis Summary
| Position | Buy |
| Buy Stop | Above 1.3042 |
| Stop loss | Below 1.2785 |
- Get Certificate

Note:
This overview has an informative and tutorial character and is published for free. All the data, included in the overview, are received from public sources, recognized as more or less reliable. Moreover, there is no guarantee that the indicated information is full and precise. Overviews are not updated. The whole information in each overview, including opinion, indicators, charts and anything else, is provided only for familiarization purposes and is not financial advice or а recommendation. The whole text and its any part, as well as the charts cannot be considered as an offer to make a deal with any asset. IFC Markets and its employees under any circumstances are not liable for any action taken by someone else during or after reading the overview.
