- Analytics
- Technical Analysis
Industrial Sector Stocks Technical Analysis - Industrial Sector Stocks Trading: 2016-09-21
Industrial stocks track broad market
Industrial stocks have been declining recently as markets brace for Federal Reserve interest rate decision. Let’s study the performance of the PCI – Industrial stocks index , composed of stocks of world’s biggest industrial companies. Will the index rise?
Industrial stocks had been rising together with the broad market index since the beginning of January. Equities retreated in recent two weeks after trading in a narrow range for almost two months since mid-August following central bank officials’ comments about a possible interest rate hike at September policy meeting. Investors are concerned a decision by Federal Reserve to raise rates will negatively affect stock prices by raising borrowing costs for companies. Currently US stocks are trading at high PE valuations: the price to earnings multiple of the SP500 index for trailing twelve months (total market capitalization divided by total earnings of SP500 companies) is at 18.6 compared with historical 16.0 average. A rate hike will also hurt earnings of manufacturing companies by making their exports less competitive as dollar strengthens with rising interest rates. Recent reading of industrial production for August came in lower than expected: industrial output contracted 0.4% in August following a 0.6% rise in previous month. While part of policy makers have expressed their preference for raising rates soon, a rate hike on Wednesday is not likely after recent weak economic data: the 0.3% fall in retail sales in August was also bigger than expected. Leaving interest rates unchanged will be bullish for equities in general and for industrial stocks particularly.
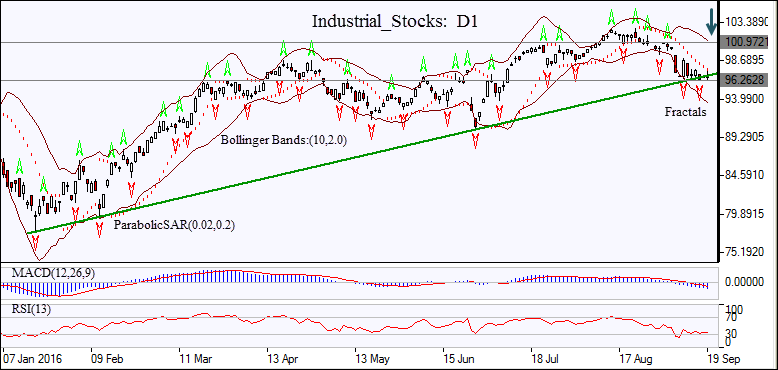
On the daily chart the Industrial_Stocks: D1 has been trading with a negative bias since mid-August. The price has breached the support line of the uptrend.
- The Bollinger bands are widening, indicating increasing volatility.
- The Parabolic indicator gives a buy signal.
- The MACD indicator is below the signal line and the gap is rising which is a bearish signal.
- The RSI oscillator is flat near the oversold zone but hasn’t breached into it yet.
We believe the bearish momentum will continue after the price closes below the last fractal low at 96.2628. It can be used as an entry point for a pending order to sell. The stop loss can be placed above the last fractal high at 100.9721. After placing the pending order, the stop loss is to be moved to the next fractal high, following Parabolic signals. By doing so, we are changing the probable profit/loss ratio to the breakeven point. The most risk-averse traders may switch to the 4-hour chart after the trade and place there a stop-loss moving it in the direction of the trade. If the price meets the stop loss level (100.9721) without reaching the order (96.2628), we recommend canceling the position: the market sustains internal changes which were not taken into account.
Technical Analysis Summary
| Position | Sell |
| Sell stop | Below 96.2628 |
| Stop loss | Above 100.9721 |
- Get Certificate

Note:
This overview has an informative and tutorial character and is published for free. All the data, included in the overview, are received from public sources, recognized as more or less reliable. Moreover, there is no guarantee that the indicated information is full and precise. Overviews are not updated. The whole information in each overview, including opinion, indicators, charts and anything else, is provided only for familiarization purposes and is not financial advice or а recommendation. The whole text and its any part, as well as the charts cannot be considered as an offer to make a deal with any asset. IFC Markets and its employees under any circumstances are not liable for any action taken by someone else during or after reading the overview.
