- Analytics
- Top Gainers / Losers
Top Gainers and Losers: US dollar and New Zealand dollar
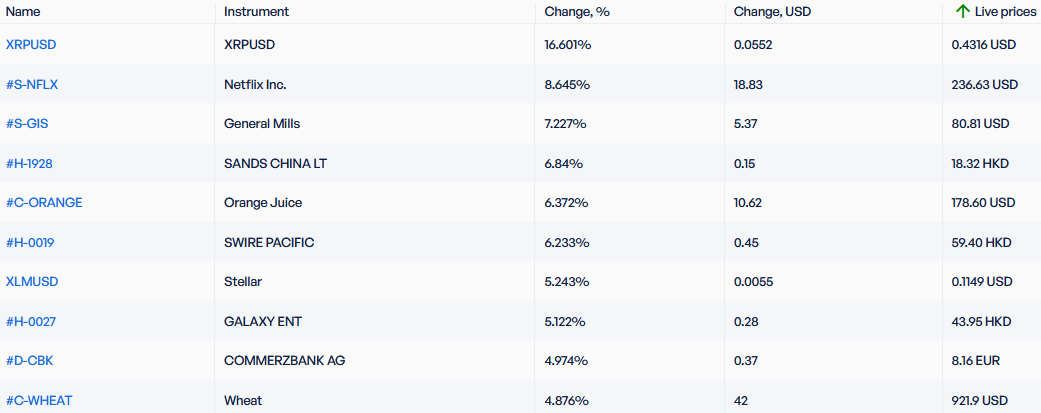
Top Gainers - global market
Over the past 7 days, the US dollar index has grown significantly and updated the maximum since June 2002. Now it is trading above the psychological level of 110 points. Over the past 12 months, the US dollar index has risen by almost 20%. The main positive for the US currency was the increase in the Fed rate to 3.25% from 2.5% at the meeting on September 21. Investors do not rule out that by March 2023 the rate may increase to 4.5%. Bank of Japan maintained a negative rate (-0.1%) at the September 22 meeting. At the same time, BOJ carried out foreign exchange intervention for the first time since 1998. This contributed to the strengthening of the yen. The Canadian dollar and the Norwegian krone weakened amid stagnation in global hydrocarbon prices. These countries actively produce and export oil and natural gas. The New Zealand Trade Balance 12-Months record deficit in August could have contributed to the decline in the New Zealand dollar quotes. Note that the negative balance of New Zealand foreign trade has been observed for 16 months in a row.
1.XRPUSD, +16,6% – Ripple cryptocurrency (XRP)
2. Netflix Inc., +8,6% – American subscription streaming service
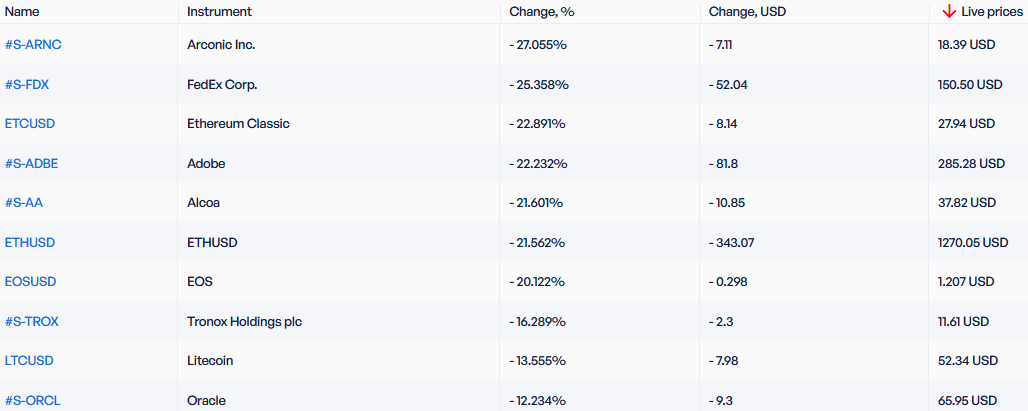
Top Losers - global market
1. Arconic Inc. – American manufacturer of aluminum products
2. FedEx Corporation –American postal and shipping company.
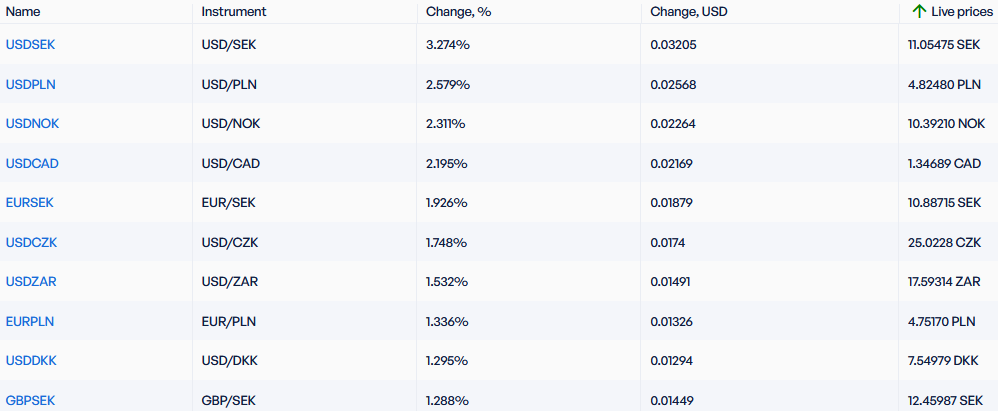
Top Gainers - foreign exchange market (Forex)
1. USDSEK, USDPLN - the growth of these charts means the strengthening of the US dollar against the Swedish krona and Polish zloty.
2. USDNOK, USDCAD - the growth of these charts means the weakening of the Norwegian krone and the Canadian dollar against the US dollar.
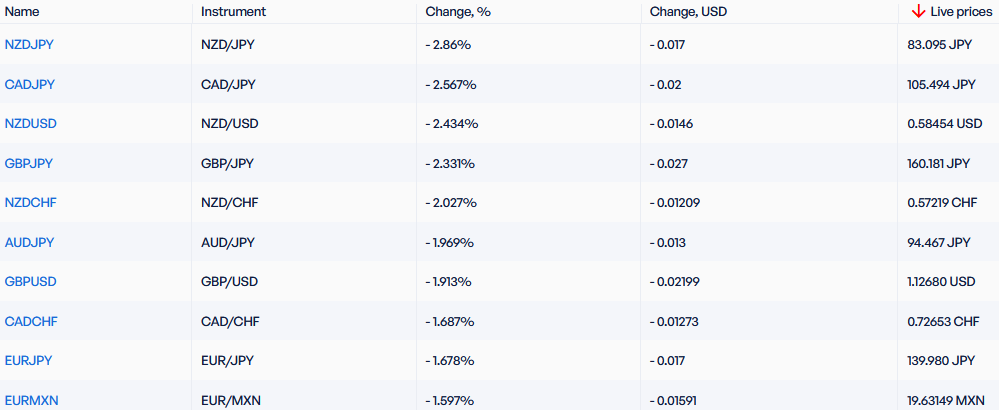
Top Losers - foreign exchange market (Forex)
1. NZDJPY, NZDUSD - the decline in these charts means the weakening of the New Zealand dollar against the Japanese yen and the US dollar.
2. CADJPY, GBPJPY - the decline in these charts means the strengthening of the Japanese yen against the Canadian dollar and the British pound.
New Exclusive Analytical Tool
Any date range - from 1 day to 1 year
Any Trading Group - Forex, Stocks, Indices, etc.
Note:
This overview has an informative and tutorial character and is published for free. All the data, included in the overview, are received from public sources, recognized as more or less reliable. Moreover, there is no guarantee that the indicated information is full and precise. Overviews are not updated. The whole information in each overview, including opinion, indicators, charts and anything else, is provided only for familiarization purposes and is not financial advice or а recommendation. The whole text and its any part, as well as the charts cannot be considered as an offer to make a deal with any asset. IFC Markets and its employees under any circumstances are not liable for any action taken by someone else during or after reading the overview.
- Get Certificate


Previous Top Gainers & Losers
Over the past 7 days, the American dollar has remained almost unchanged. According to the CME FedWatch tool, there is an 89% probability of the U.S. Federal Reserve raising interest rates at the meeting on July 26th. The Swiss franc has strengthened due to positive economic indicators such as Credit...
Over the past 7 days, the US dollar index has declined. As expected, the Federal Reserve (Fed) maintained its interest rate at 5.25% during the meeting on June 14. Now, investors are monitoring economic statistics and trying to forecast the change in the Fed's rate at the next meeting on July 26. The...
Over the past 7 days, the US dollar index has remained largely unchanged. It has been trading in a narrow range of 103.2-104.4 points for the 4th week in a row. Investors are awaiting the outcome of the Federal Reserve meeting on June 14. Tesla shares have risen due to the opening of new gigafactories...