- マーケット分析
- 値上がり率と値下がり率
Top Gainers and Losers: US dollar and New Zealand dollar
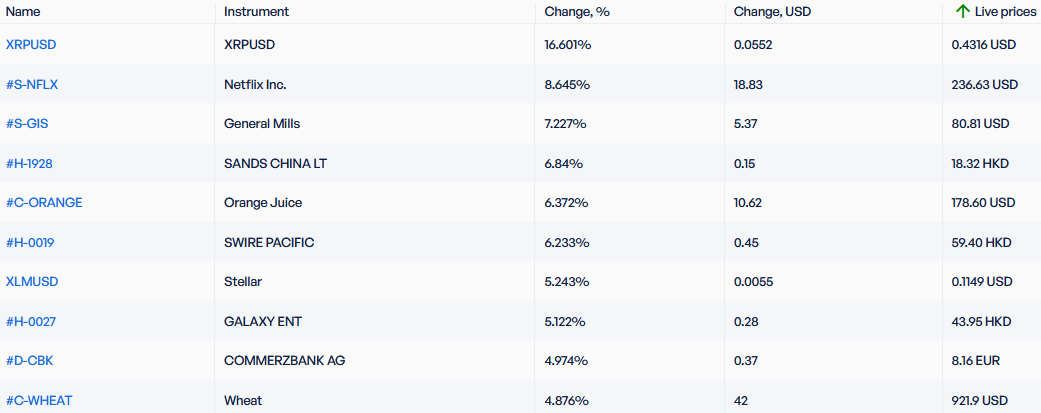
Top Gainers - global market
Over the past 7 days, the US dollar index has grown significantly and updated the maximum since June 2002. Now it is trading above the psychological level of 110 points. Over the past 12 months, the US dollar index has risen by almost 20%. The main positive for the US currency was the increase in the Fed rate to 3.25% from 2.5% at the meeting on September 21. Investors do not rule out that by March 2023 the rate may increase to 4.5%. Bank of Japan maintained a negative rate (-0.1%) at the September 22 meeting. At the same time, BOJ carried out foreign exchange intervention for the first time since 1998. This contributed to the strengthening of the yen. The Canadian dollar and the Norwegian krone weakened amid stagnation in global hydrocarbon prices. These countries actively produce and export oil and natural gas. The New Zealand Trade Balance 12-Months record deficit in August could have contributed to the decline in the New Zealand dollar quotes. Note that the negative balance of New Zealand foreign trade has been observed for 16 months in a row.
1.XRPUSD, +16,6% – Ripple cryptocurrency (XRP)
2. Netflix Inc., +8,6% – American subscription streaming service
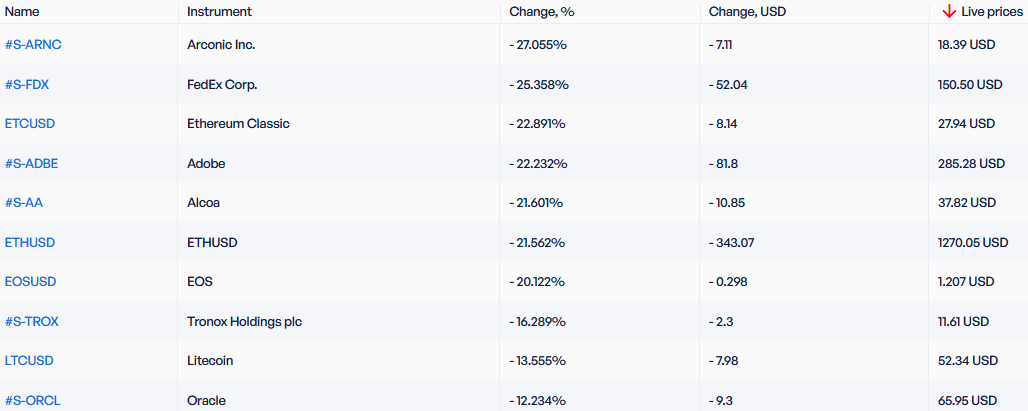
Top Losers - global market
1. Arconic Inc. – American manufacturer of aluminum products
2. FedEx Corporation –American postal and shipping company.
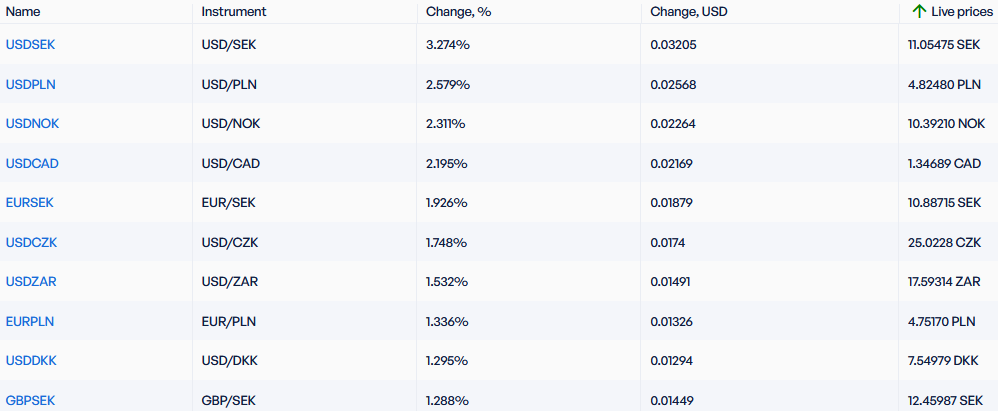
Top Gainers - foreign exchange market (Forex)
1. USDSEK, USDPLN - the growth of these charts means the strengthening of the US dollar against the Swedish krona and Polish zloty.
2. USDNOK, USDCAD - the growth of these charts means the weakening of the Norwegian krone and the Canadian dollar against the US dollar.
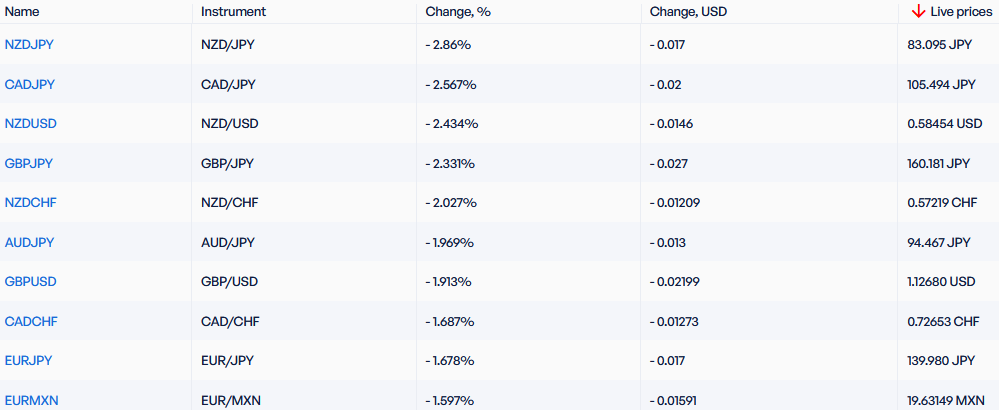
Top Losers - foreign exchange market (Forex)
1. NZDJPY, NZDUSD - the decline in these charts means the weakening of the New Zealand dollar against the Japanese yen and the US dollar.
2. CADJPY, GBPJPY - the decline in these charts means the strengthening of the Japanese yen against the Canadian dollar and the British pound.
【重要な注意事項】:
本レポートは、当社の親会社であるアイエフシーマーケットが作成したものの邦訳です。本レポートには、当社のサービスと商品についての情報を含みますが、お客様の投資目的、財務状況、資金力にかかわらず、情報の提供のみを目的とするものであり、金融商品の勧誘、取引の推奨、売買の提案等を意図したものではありません。 本レポートは、アイエフシーマーケットが信頼できると思われる情報にもとづき作成したものですが、次の点に十分ご留意ください。アイエフシーマーケットおよび当社は、本レポートが提供する情報、分析、予測、取引戦略等の正確性、確実性、完全性、安全性等について一切の保証をしません。アイエフシーマーケットおよび当社は、本レポートを参考にした投資行動が利益を生んだり損失を回避したりすることを保証または約束あるいは言外に暗示するものではありません。アイエフシーマーケットおよび当社は、本レポートに含まれる不確実性、不正確性、不完全性、誤謬、文章上の誤り等に起因して、お客様または第三者が損害(直接的か間接的かを問いません。)を被った場合でも、一切の責任を負いません。
- コースを取って、


過去の安値・高値
Over the past 7 days, the American dollar has remained almost unchanged. According to the CME FedWatch tool, there is an 89% probability of the U.S. Federal Reserve raising interest rates at the meeting on July 26th. The Swiss franc has strengthened due to positive economic indicators such as Credit...
Over the past 7 days, the US dollar index has declined. As expected, the Federal Reserve (Fed) maintained its interest rate at 5.25% during the meeting on June 14. Now, investors are monitoring economic statistics and trying to forecast the change in the Fed's rate at the next meeting on July 26. The...
Over the past 7 days, the US dollar index has remained largely unchanged. It has been trading in a narrow range of 103.2-104.4 points for the 4th week in a row. Investors are awaiting the outcome of the Federal Reserve meeting on June 14. Tesla shares have risen due to the opening of new gigafactories...