- Analisi
- Analisi Tecnica
Indice Azionario Australiano Analisi Tecnica - Indice Azionario Australiano Trading: 2020-10-09
ASX 200 Technical Analysis Summary
Sopra 6200
Buy Stop
Sotto 5700
Stop Loss
| Indicator | Signal |
| RSI | Neutro |
| MACD | Buy |
| MA(200) | Neutro |
| Fractals | Neutro |
| Parabolic SAR | Buy |
| Bollinger Bands | Neutro |
ASX 200 Chart Analysis
ASX 200 Analisi Tecnica
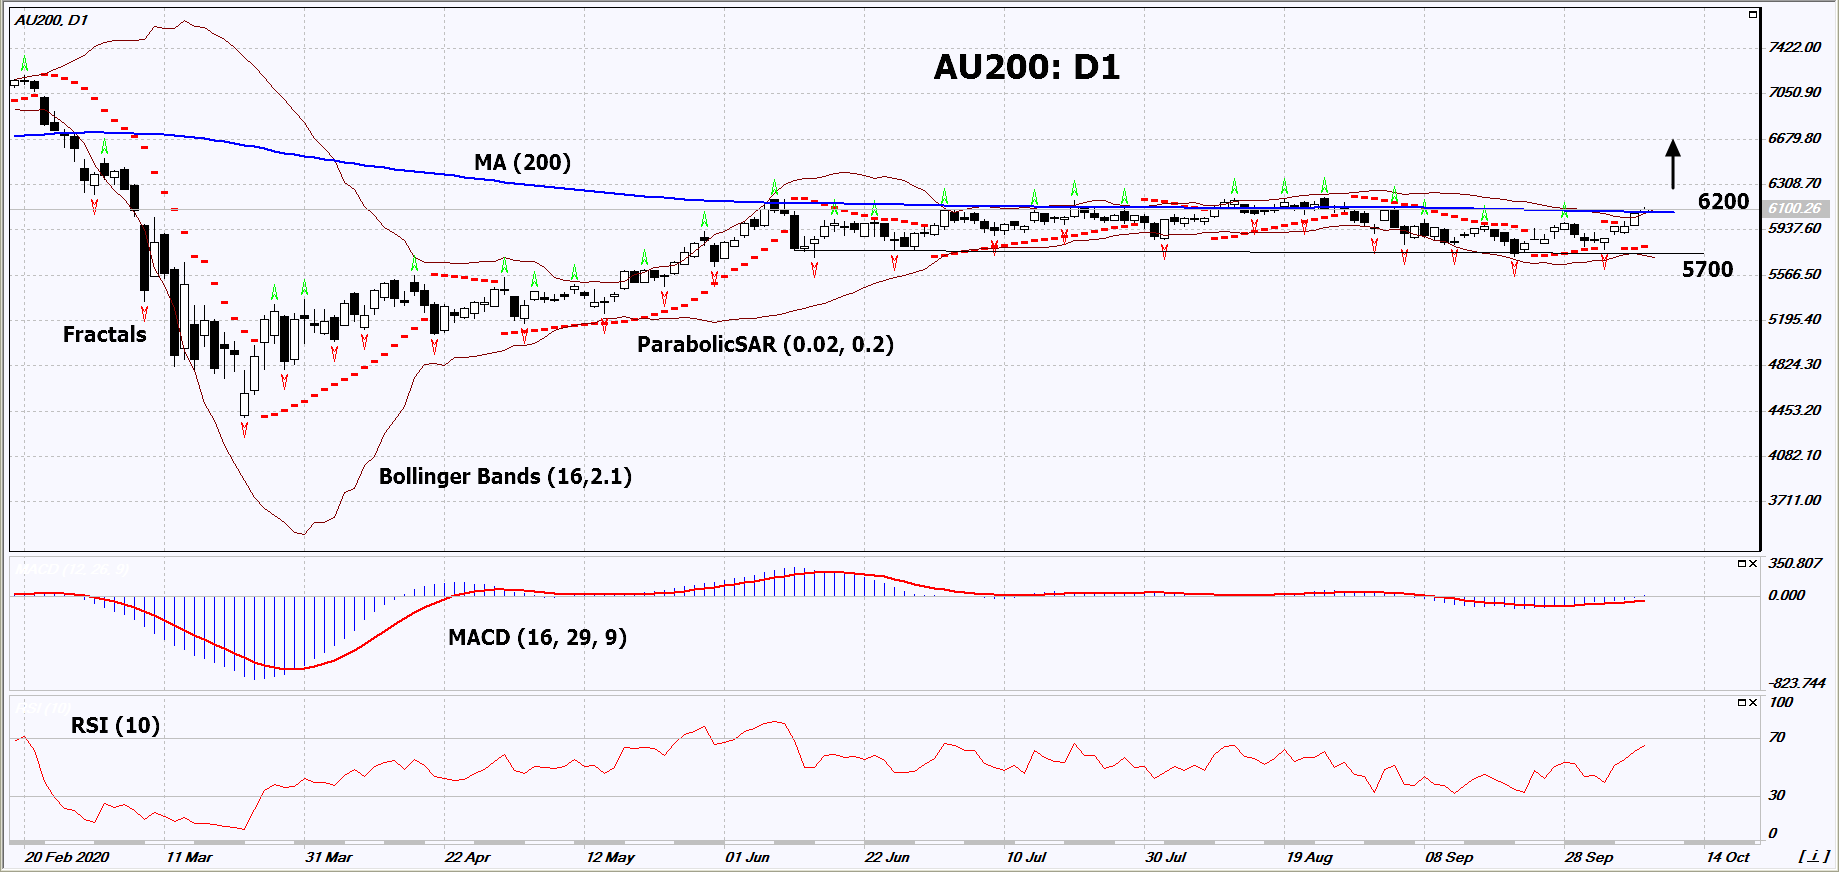
On the daily timeframe, AU200: D1 is being traded in a narrow neutral range for the 5th month already. It must be broken upward before opening a position. A number of technical analysis indicators formed signals for further growth. We do not rule out a bullish move if AU200 rises above the 200-day MA and Bollinger Upper Line: 6200. This level can be used as an entry point. We can place a stop loss below the Parabolic signal, the lower Bollinger line, the 2 last lower fractals: 5700. After opening a pending order, we move the stop loss following the Bollinger and Parabolic signals to the next fractal minimum. Thus, we change the potential profit/loss ratio in our favor. After the transaction, the most risk-averse traders can switch to the four-hour chart and set a stop loss, moving it in the direction of the trend. If the price meets the stop loss (5700) without activating the order (6200), it is recommended to delete the order: some internal changes in the market have not been taken into account.
Analisi Fondamentale Indici - ASX 200
The recent growth of commodity prices could help strengthen the Australian economy, which is a major exporter of commodities. Will AU200 quotes grow ?
Australia's GDP fell 7% in the 2nd quarter of 2020. This is less than in the European Union (-11.8%), the USA (-31.4%), Japan (-7.9%) and other developed countries. Reserve Bank of Australia (RBA) at its meeting on October 6 kept the rate at a historic low of 0.25% and announced its readiness to further ease monetary policy in order to stimulate the Australian economy. Investors expect the RBA rate to drop to 0.1% in November and the launch of the bond buyback program. This could support the rise in the S&P/ASX 200 stock index. Australia exports a range of commodities and minerals: mainly coal, oil and liquefied natural gas, various ores and metals, including non-ferrous and precious ones. They account for approximately 45% of exports and another 10% includes meat, grain crops and other agricultural products.
Explore our
Trading Conditions
- Spreads from 0.0 pip
- 30,000+ Trading Instruments
- Instant Execution
Ready to Trade?
Open Account Note:
Questa panormaica è di carattere informativo-educativo e viene pubblicata gratuitamente. Tutti i dati compresi nella panoramica sono ottenuti da fonti pubbliche conosciute più o meno affidabili. Inoltre non c'è alcuna garanzia che le informazioni fornite siano precise e complete. Le panoramiche non vengono aggiornate. Tutta l'informazione in ciascuna panoramica, compresi indicatori, opinioni, grafici e o quant'altro, è fornita a scopo conoscitivo e non è un consiglio finanziario. Tutto il testo e qualsiasi delle sue parti, e anche i grafici non possono essere considerati un'offerta per effettuare un'operazione con un qualsiasi asset. IFC Markets e i suoi impiegati in alcun caso non sono responsabili per qualsiasi azione intrapresa sulla base delle informazioni contenute.

