- Analisi
- Analisi Tecnica
LTCUSD Analisi Tecnica - LTCUSD Trading: 2025-06-30
LTCUSD Technical Analysis Summary
Sopra 88.09
Buy Stop
Sotto 91.39
Stop Loss
| Indicator | Signal |
| RSI | Neutro |
| MACD | Buy |
| MA(200) | Sell |
| Fractals | Buy |
| Parabolic SAR | Buy |
LTCUSD Chart Analysis
LTCUSD Analisi Tecnica
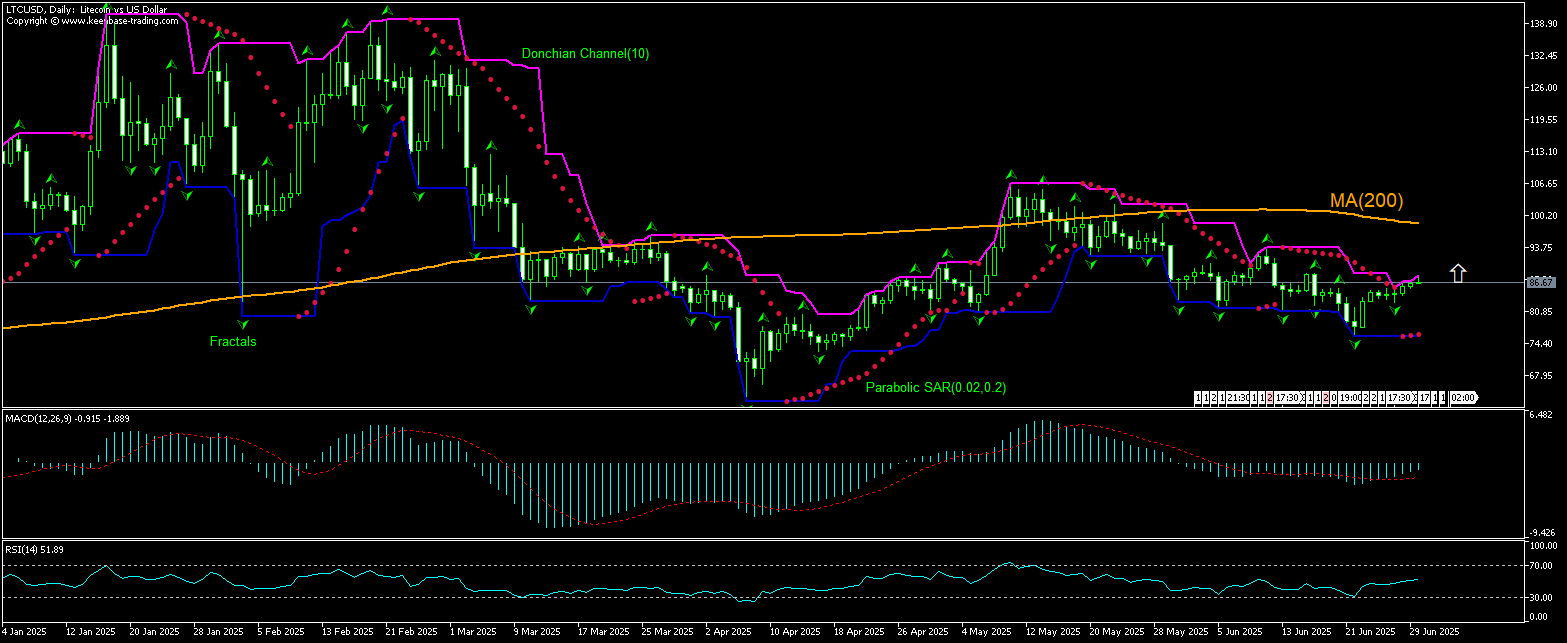
The LTCUSD technical analysis of the price chart on daily timeframe shows LTCUSD,Daily is rebounding toward the 200-period moving average MA(200) after hitting 9-week low eight days ago. We believe the bullish momentum will continue after the price breaches above the upper boundary of Donchian channel at 88.09. A level above this can be used as an entry point for placing a pending order to buy. The stop loss can be placed below 81.39. After placing the order, the stop loss is to be moved to the next fractal low , following Parabolic indicator signals. Thus, we are changing the expected profit/loss ratio to the breakeven point. If the price meets the stop loss level without reaching the order, we recommend cancelling the order: the market has undergone internal changes which were not taken into account.
Analisi Fondamentale Cripto - LTCUSD
LTCUSD is attempting a rebound as traders bet on LTC ETF approval. Will the LTCUSD price rebound continue?
Litecoin (LTC) rose almost 9% last week as traders anticipate a regulatory boost: the U.S. Securities and Exchange Commission is reviewing two bids for a spot Litecoin ETF. Couple of weeks ago Bloomberg analyst Seyffart estimated the chances for a Litecoin spot ETF being greenlighted this year stand at 90%. Polymarket traders assign an 83% chance to SEC approval of a LTC ETF this year. A green light to such a fund this year would open LTC exposure to investors betting on crypto through traditional brokerages. Expectations of a LTC ETF approval by SEC are bullish for LTCUSD price.
Explore our
Trading Conditions
- Spreads from 0.0 pip
- 30,000+ Trading Instruments
- Instant Execution
Ready to Trade?
Open Account Note:
Questa panormaica è di carattere informativo-educativo e viene pubblicata gratuitamente. Tutti i dati compresi nella panoramica sono ottenuti da fonti pubbliche conosciute più o meno affidabili. Inoltre non c'è alcuna garanzia che le informazioni fornite siano precise e complete. Le panoramiche non vengono aggiornate. Tutta l'informazione in ciascuna panoramica, compresi indicatori, opinioni, grafici e o quant'altro, è fornita a scopo conoscitivo e non è un consiglio finanziario. Tutto il testo e qualsiasi delle sue parti, e anche i grafici non possono essere considerati un'offerta per effettuare un'operazione con un qualsiasi asset. IFC Markets e i suoi impiegati in alcun caso non sono responsabili per qualsiasi azione intrapresa sulla base delle informazioni contenute.

