- Analisi
- Analisi Tecnica
Gas Naturale Analisi Tecnica - Gas Naturale Trading: 2020-11-09
Gas Naturale Technical Analysis Summary
Sotto 2,94
Sell Stop
Sopra 3,4
Stop Loss
| Indicator | Signal |
| RSI | Sell |
| MACD | Sell |
| MA(200) | Neutro |
| Fractals | Neutro |
| Parabolic SAR | Sell |
| Bollinger Bands | Sell |
Gas Naturale Chart Analysis
Gas Naturale Analisi Tecnica
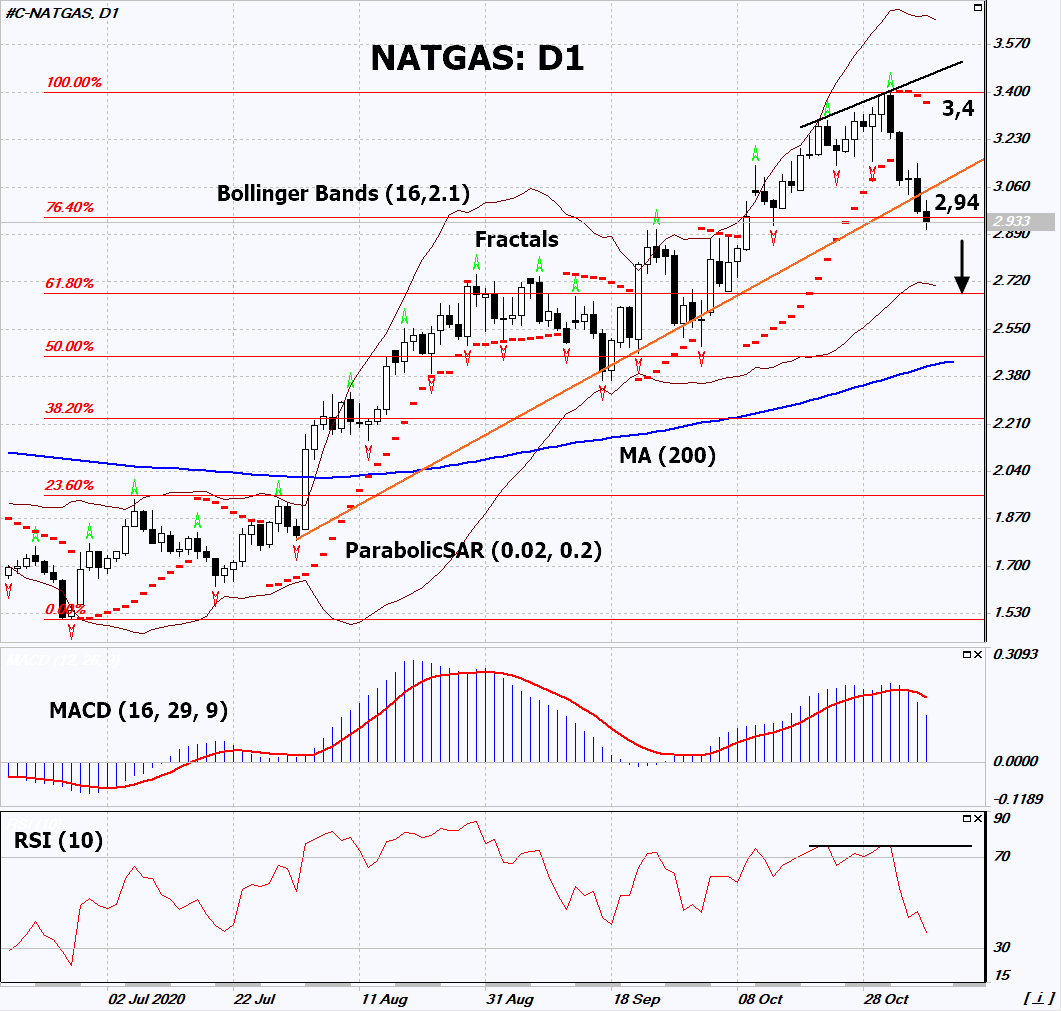
On the daily timeframe, NATGAS: D1 is correcting downward from the maximum since January 2019. It broke down the uptrend support line. A number of technical analysis indicators generated signals for further decline. We do not rule out a bearish movement if NATGAS falls below the 1st Fibonacci line: 2.94. This level can be used as an entry point. We can place a stop loss above the last upper fractal and Parabolic signal: 3.4. After opening a pending order, we can move the stop loss to the next fractal maximum following the Bollinger and Parabolic signals. Thus, we change the potential profit/loss ratio in our favor. After the transaction, the most risk-averse traders can switch to the 4-hour chart and set a stop loss, moving it in the direction of the bias. If the price meets the stop loss (3.4) without activating the order (2.94), it is recommended to delete the order: some internal changes in the market have not been taken into account.
Analisi Fondamentale Materie Prime - Gas Naturale
Warm weather in the USA can last 2 more weeks. Will the NATGAS quotes continue to decline?
The US uses natural gas for heating, so its prices depend on the weather. Commodity Weather Group predicts that warm weather in the US will last until at least November 20. Abnormal heat will be observed in the eastern part of the country. Warming has already caused a 13.5% drop in natural gas prices last week. Meanwhile, US gas consumption lowered by about 20% to 65.6 billion cubic feet. Due to the increase in the number of coronavirus cases, business activity and, as a result, the electricity production have decreased. According to Edison Electric, in the week ending October 31, US electricity production declined by 1.8% compared to the past year. This is another negative factor for natural gas prices, which is also used as a fuel for power plants. According to the US Energy Information Administration, gas reserves in the United States are now near a 3-year high. They are 5.1% higher than last year's level and 5.4% higher than the 5-year average.
Explore our
Trading Conditions
- Spreads from 0.0 pip
- 30,000+ Trading Instruments
- Stop Out Level - Only 10%
Ready to Trade?
Open Account Note:
Questa panormaica è di carattere informativo-educativo e viene pubblicata gratuitamente. Tutti i dati compresi nella panoramica sono ottenuti da fonti pubbliche conosciute più o meno affidabili. Inoltre non c'è alcuna garanzia che le informazioni fornite siano precise e complete. Le panoramiche non vengono aggiornate. Tutta l'informazione in ciascuna panoramica, compresi indicatori, opinioni, grafici e o quant'altro, è fornita a scopo conoscitivo e non è un consiglio finanziario. Tutto il testo e qualsiasi delle sue parti, e anche i grafici non possono essere considerati un'offerta per effettuare un'operazione con un qualsiasi asset. IFC Markets e i suoi impiegati in alcun caso non sono responsabili per qualsiasi azione intrapresa sulla base delle informazioni contenute.

