- Analítica
- Análise Técnica
Gás natural Análise técnica - Gás natural Negociação: 2020-11-09
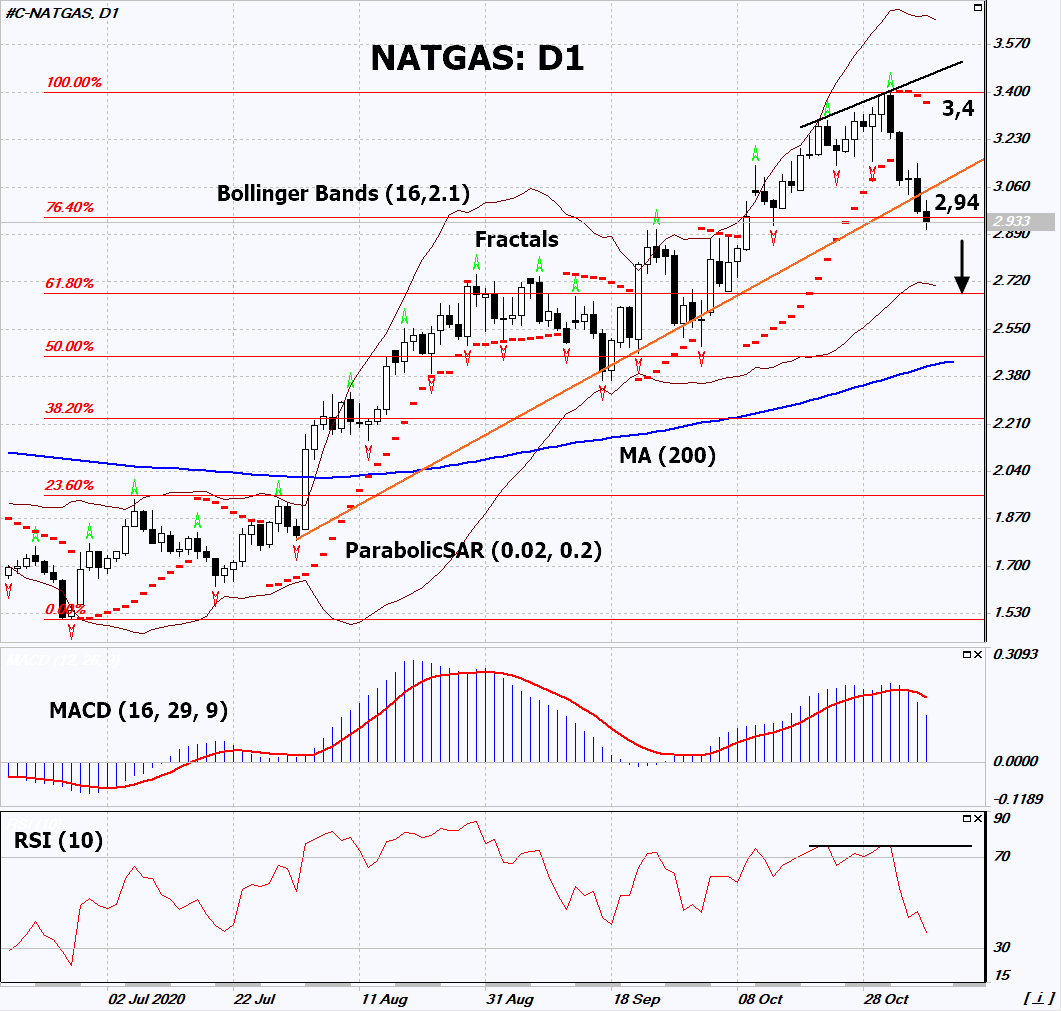
Gas Natural Resumo da Análise Técnica
abaixo de 2,94
Sell Stop
acima de 3,4
Stop Loss
| Indicador | Sinal |
| RSI | Vender |
| MACD | Vender |
| MA(200) | Neutro |
| Fractals | Neutro |
| Parabolic SAR | Vender |
| Bollinger Bands | Vender |
Gas Natural Análise gráfica
Gas Natural Análise Técnica
On the daily timeframe, NATGAS: D1 is correcting downward from the maximum since January 2019. It broke down the uptrend support line. A number of technical analysis indicators generated signals for further decline. We do not rule out a bearish movement if NATGAS falls below the 1st Fibonacci line: 2.94. This level can be used as an entry point. We can place a stop loss above the last upper fractal and Parabolic signal: 3.4. After opening a pending order, we can move the stop loss to the next fractal maximum following the Bollinger and Parabolic signals. Thus, we change the potential profit/loss ratio in our favor. After the transaction, the most risk-averse traders can switch to the 4-hour chart and set a stop loss, moving it in the direction of the bias. If the price meets the stop loss (3.4) without activating the order (2.94), it is recommended to delete the order: some internal changes in the market have not been taken into account.
Análise Fundamental de Mercadorias - Gas Natural
Warm weather in the USA can last 2 more weeks. Will the NATGAS quotes continue to decline?
The US uses natural gas for heating, so its prices depend on the weather. Commodity Weather Group predicts that warm weather in the US will last until at least November 20. Abnormal heat will be observed in the eastern part of the country. Warming has already caused a 13.5% drop in natural gas prices last week. Meanwhile, US gas consumption lowered by about 20% to 65.6 billion cubic feet. Due to the increase in the number of coronavirus cases, business activity and, as a result, the electricity production have decreased. According to Edison Electric, in the week ending October 31, US electricity production declined by 1.8% compared to the past year. This is another negative factor for natural gas prices, which is also used as a fuel for power plants. According to the US Energy Information Administration, gas reserves in the United States are now near a 3-year high. They are 5.1% higher than last year's level and 5.4% higher than the 5-year average.
Explore nossas
condições de trading
- Spreads a partir de0.0 pip
- 30,000+ Ferramentas de Trading
- Nível de Stop Out - Apenas 10%
Ready to Trade ?
Abrir Conta Nota de rodapé:
Esta visão geral é apenas para fins informativos e educacionais, e é publicada de forma gratuita. Todos os dados contidos neste documento são obtidos de fontes públicas que são consideradas mais ou menos confiáveis. Ao mesmo tempo, não há garantias de que as informações são completas e precisas. No futuro, as visões separadas não são atualizadas. Todas as informações em cada visão geral, incluindo opiniões, índices, gráficos etc., são apresentadas apenas para fins informativos e não são aconselhamentos financeiros ou recomendações. Todo o texto e qualquer parte dele, assim como os gráficos não podem ser considerados como uma oferta para realizar quaisquer transações com qualquer ativo. A empresa IFC Markets e seus funcionários sob nenhumas circunstâncias não são responsáveis por quaisquer acções, realizados por uma pessoa durante ou depois de ler a visão geral.

