- 분석
- 기술적 분석
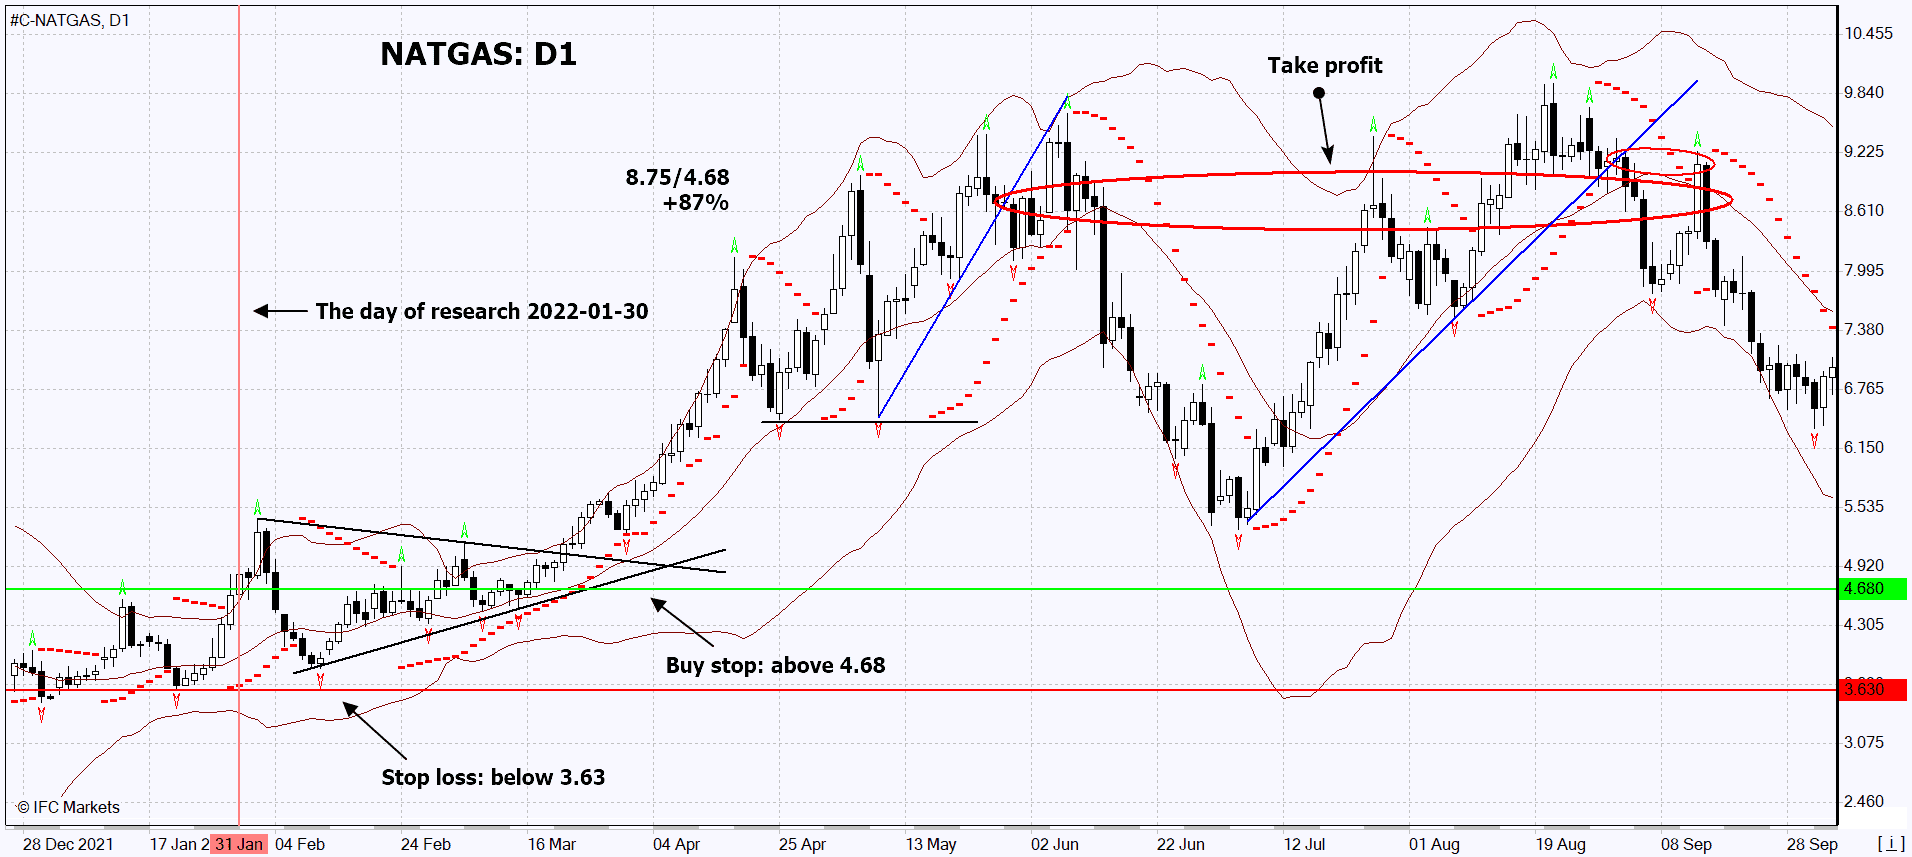
RETRO_TECHNICAL #C-NATGAS FROM 2022-01-31
미국에서 천연 가스 수요가 증가할 수 있습니다.

| Buy stop | 4.68 |
| Take profit | 8.75 |
| Return on Investment | +87% |
| Overview date | 2022-01-31 |
| Date of the closing position | from 2022-05-30 to 2022-09-15 |
The chart shows the real change of quotations after the publication of technical analysis on 2022-01-31. The pending order from this analysis was executed and the position was opened. Next, we shall move the stop to the next fractal low following the Bollinger Bands and Parabolic SAR signals at the 4-hour charts. Thus, we are changing the potential profit/loss to the breakeven point. The position shall be closed when the price meets the Bollinger bands, the Parabolic SAR, the trend line and the fractal indicator.