- Analítica
- Análise Técnica
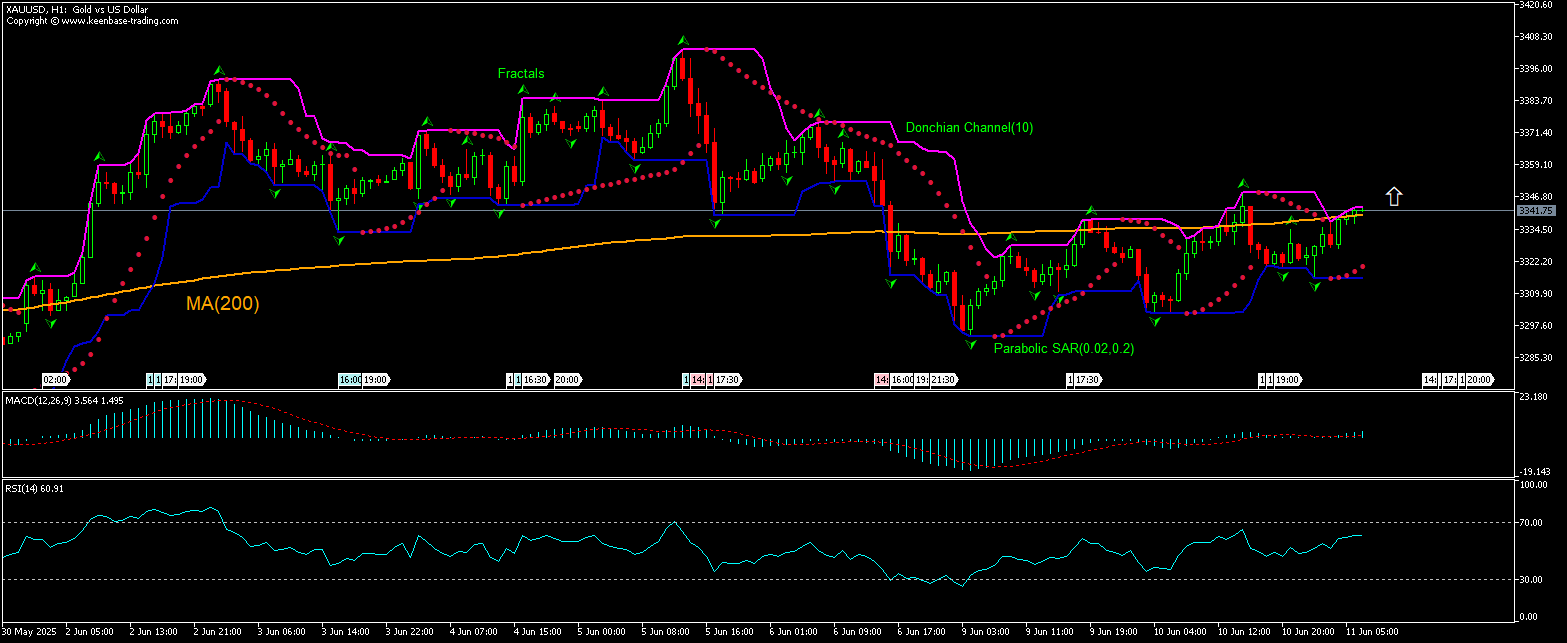
Ouro Análise técnica - Ouro Negociação: 2025-06-11
Ouro Resumo da Análise Técnica
acima de 3342.93
Buy Stop
abaixo de 3320.29
Stop Loss
| Indicador | Sinal |
| RSI | Neutro |
| MACD | Comprar |
| Donchian Channel | Neutro |
| MA(200) | Vender |
| Fractals | Neutro |
| Parabolic SAR | Comprar |
Ouro Análise gráfica
Ouro Análise Técnica
The technical analysis of XAUUSD price on the 1-hour timeframe shows XAUUSD,H1 is testing the 200-period moving average MA(200) as it rebounds after hitting 10-day low two days ago. We believe the bullish momentum will continue after the price breaches above the upper Donchian boundary at 3342.93. This level can be used as an entry point for placing a pending order to buy. The stop loss can be placed below 3320.29. After placing the pending order the stop loss is to be moved every day to the next fractal low indicator, following Parabolic signals. Thus, we are changing the expected profit/loss ratio to the breakeven point. If the price meets the stop-loss level (3320.29) without reaching the order (3342.93) we recommend cancelling the order: the market sustains internal changes which were not taken into account.
Análise Fundamental de Metais Preciosos - Ouro
Banks report rising bullish momentum for gold. Will the XAUUSD rebound continue?
Société Générale wrote in a note gold is poised to move higher as economic uncertainty drives investor demand. Analysts point to strong central bank purchases of gold to raise their gold reserves as one of main drivers for safe haven precious metal. They also note that hedge fund managers are also raising their bullish bets after eight consecutive weeks of decline, rising from 88 funds to 106 in the last week. At the same time, Well’s Fargo also notes rising demand for safe haven, predicting ‘economic uncertainties and geopolitical tensions’ will drive gold to $3,600 pre ounce by 2026. Rising demand for gold under high geopolitical uncertainty is bullish for XAUUSD.
Explore nossas
condições de trading
- Spreads a partir de0.0 pip
- 30,000+ Ferramentas de Trading
- Execução Instantânea
Ready to Trade ?
Abrir Conta Nota de rodapé:
Esta visão geral é apenas para fins informativos e educacionais, e é publicada de forma gratuita. Todos os dados contidos neste documento são obtidos de fontes públicas que são consideradas mais ou menos confiáveis. Ao mesmo tempo, não há garantias de que as informações são completas e precisas. No futuro, as visões separadas não são atualizadas. Todas as informações em cada visão geral, incluindo opiniões, índices, gráficos etc., são apresentadas apenas para fins informativos e não são aconselhamentos financeiros ou recomendações. Todo o texto e qualquer parte dele, assim como os gráficos não podem ser considerados como uma oferta para realizar quaisquer transações com qualquer ativo. A empresa IFC Markets e seus funcionários sob nenhumas circunstâncias não são responsáveis por quaisquer acções, realizados por uma pessoa durante ou depois de ler a visão geral.

