- Analítica
- Análise Técnica
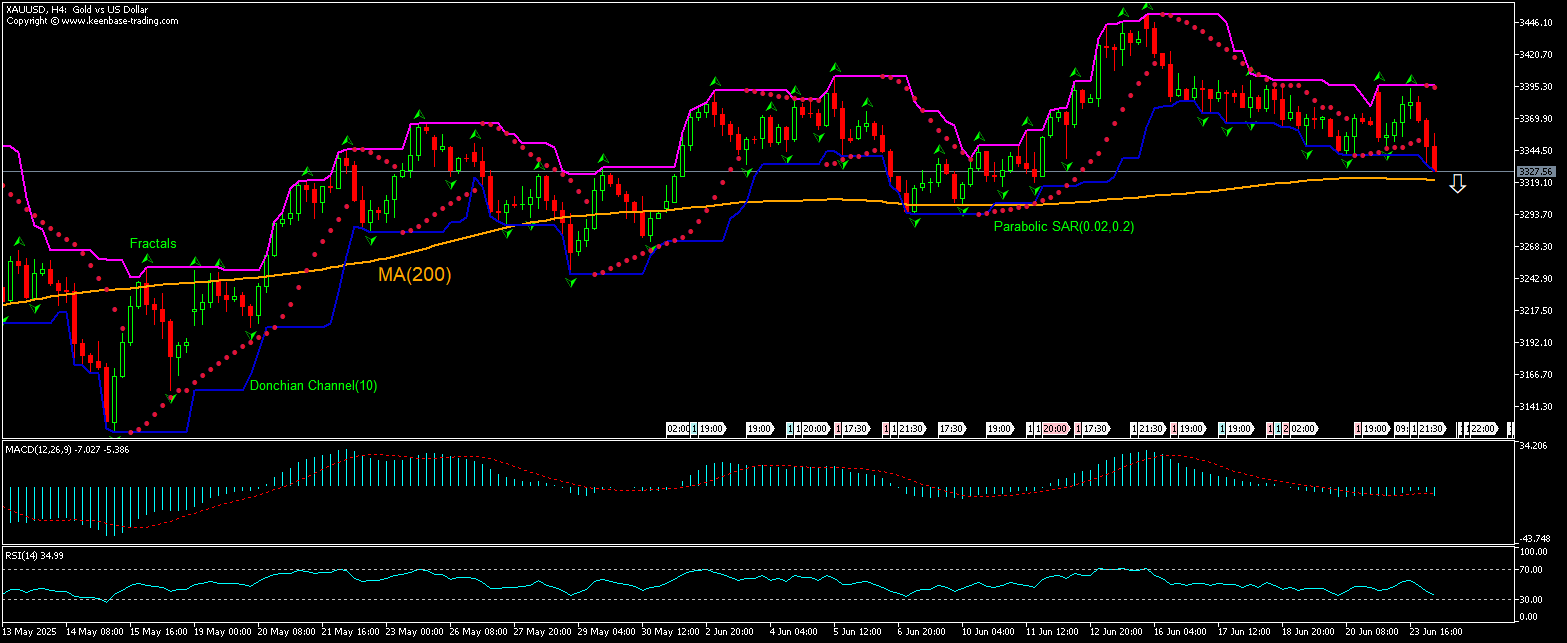
Ouro Análise técnica - Ouro Negociação: 2025-06-24
Ouro Resumo da Análise Técnica
abaixo de 3325.23
Sell Stop
acima de 3391.78
Stop Loss
| Indicador | Sinal |
| RSI | Neutro |
| MACD | Vender |
| Donchian Channel | Vender |
| MA(200) | Comprar |
| Fractals | Neutro |
| Parabolic SAR | Vender |
Ouro Análise gráfica
Ouro Análise Técnica
The technical analysis of XAUUSD price on the 1-hour timeframe shows XAUUSD,H1 is testing the 200-period moving average MA(200) as it is retracing down after hitting 2-week high eight days ago. We believe the bearish momentum will continue after the price breaches below the lower Donchian boundary at 3325.23. This level can be used as an entry point for placing a pending order to sell. The stop loss can be placed above 3391.78. After placing the pending order the stop loss is to be moved every day to the next fractal high indicator, following Parabolic signals. Thus, we are changing the expected profit/loss ratio to the breakeven point. If the price meets the stop-loss level (3391.78) without reaching the order (3325.23) we recommend cancelling the order: the market sustains internal changes which were not taken into account.
Análise Fundamental de Metais Preciosos - Ouro
Gold prices are retreating after Iran’s missile attack on a US airbase in Qatar. Will the XAUUSD retreating continue?
Iran responded with a missile attack on a US airbase in Qatar after the US conducted aerial attack on Iran’s nuclear facilities. Usually in periods of heightened geopolitical uncertainty demand for safe haven precious metal rises as investors increase their holdings of gold for the ability of the safe haven asset to preserve its value. Currently though prices have been struggling to hold above $3,400 an ounce as it trades in a sideways pattern. However, major investment banks remain bullish on the safe haven precious metal. UBS particularly remains bullish on gold, maintaining its upside target of $3,800 an ounce. Banks’ bullish sentiment for gold is an upside risk for XAUUSD price.
Explore nossas
condições de trading
- Spreads a partir de0.0 pip
- 30,000+ Ferramentas de Trading
- Execução Instantânea
Ready to Trade ?
Abrir Conta Nota de rodapé:
Esta visão geral é apenas para fins informativos e educacionais, e é publicada de forma gratuita. Todos os dados contidos neste documento são obtidos de fontes públicas que são consideradas mais ou menos confiáveis. Ao mesmo tempo, não há garantias de que as informações são completas e precisas. No futuro, as visões separadas não são atualizadas. Todas as informações em cada visão geral, incluindo opiniões, índices, gráficos etc., são apresentadas apenas para fins informativos e não são aconselhamentos financeiros ou recomendações. Todo o texto e qualquer parte dele, assim como os gráficos não podem ser considerados como uma oferta para realizar quaisquer transações com qualquer ativo. A empresa IFC Markets e seus funcionários sob nenhumas circunstâncias não são responsáveis por quaisquer acções, realizados por uma pessoa durante ou depois de ler a visão geral.

