- Analytics
- Technical Analysis
USD JPY Technical Analysis - USD JPY Trading: 2015-10-15
US inflation data to come out
On Thursday at 14-30 СЕТ the important macroeconomic data on inflation will be released in the US. The tentative outlook for dollar is negative. Will the dollar continue weakening?
Investors expect the US inflation in September to fall back into negative territory which may signify lower demand. Now it points to the weakness of the US economy. This, taken together with the weak labor market statistics released at the beginning of the current month, reduces even more the likelihood of the rate hike by the Fed. On Wednesday the September Producer price index was released which fell below zero. Moreover, the US Retail Sales increased less than expected. The growth was only due to the increased car sales amid low fuel prices. The additional factor for the current close to zero rates to remain unchanged is relatively weak inflation data from China. Previously the Fed stated that it would consider the global and Chinese economic risks. In our opinion, in case of sharply negative US CPI the trade in any currency against the dollar may work out. Nevertheless, we suggest studying the USD JPY chart as yen may benefit from the likely weakening of China.
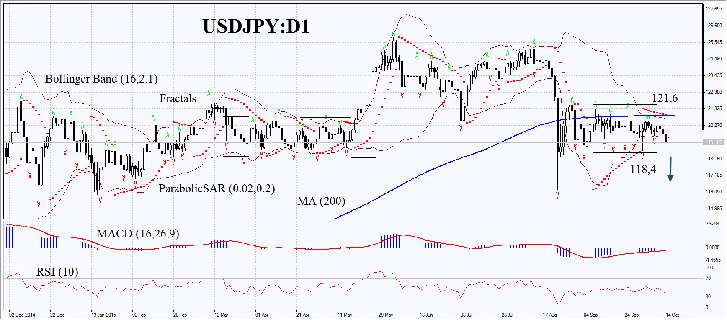
On the daily chart USDJPY:D1 is flat for the 7th week in a row. The decline of the price means the yen strengthening against the dollar. USDJPY was attempting to surpass the 200-day moving average a few times but failed and now it has verged the support line. The Bollinger Bands have contracted a lot which may signify the strong price movements. Parabolic gives sell signal. The MACD indicator is neutral in our opinion. The forex RSI is below 50 and has approached the oversold zone. We believe the bearish momentum may develop in case the yen breaks down the bound of the neutral range and the lower Parabolic signal at 118.4. The moment may serve the point of entry. The initial risk-limits may be placed below the Parabolic signal,Bollinger Band, 200-day moving average and the fractal highs at 121.6. Having opened the pending order we shall move the stop to the next fractal. Thus, we are changing the probable profit/loss ratio to the breakeven point. The most risk-averse traders may switch to the 4-hour chart after the trade and place there a stop-loss moving it in the direction of the trade. If the price meets the stop-loss level of 121.6 without reaching the order of 118.4, we recommend cancelling the position: the market sustains internal changes which were not taken into account.
| Position | Buy |
| Sell stop | below 118,4 |
| Stop loss | above 121,6 |
Explore our
Trading Conditions
- Spreads from 0.0 pip
- 30,000+ Trading Instruments
- Stop Out Level - Only 10%
Ready to Trade?
Open Account Note:
This overview has an informative and tutorial character and is published for free. All the data, included in the overview, are received from public sources, recognized as more or less reliable. Moreover, there is no guarantee that the indicated information is full and precise. Overviews are not updated. The whole information in each overview, including opinion, indicators, charts and anything else, is provided only for familiarization purposes and is not financial advice or а recommendation. The whole text and its any part, as well as the charts cannot be considered as an offer to make a deal with any asset. IFC Markets and its employees under any circumstances are not liable for any action taken by someone else during or after reading the overview.
