- Analytik
- Technische Analyse
Kakao Technische Analyse - Kakao Handel: 2019-05-22
There is little rainfall in West Africa
There is a lack of rain in West Africa and especially in Côte d'Ivoire. Will the cocoa quotations continue increasing ?
Cote d'Ivoire farmers report a lack of moisture, which leads to the production of poor quality beans. This may reduce the harvest in the current intermediate season, which lasts from April to September. According to Cocobod, cocoa production in Ghana during the current crop season will be reduced to 850 thousand tons from 900 thousand tons a season earlier. In the mid-May, the International Cocoa Organization (ICCO) confirmed the forecast of world cocoa production in the season 2018/19 amounted 4.8 million tons. Of these, Côte d'Ivoire accounts for 2.2 million tons, or about 46%. If crop forecasts are revised downwards due to the development of drought in African countries, this may contribute to the growth of cocoa quotations.
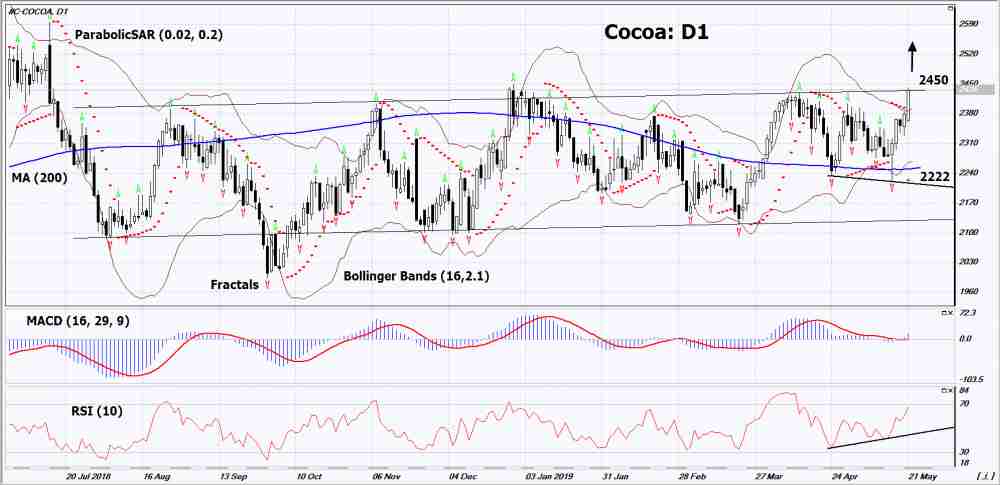
On the daily timeframe Cocoa: D1 approached the upper boundary of the long-term neutral trend. Before opening a buy position, it must be pierced to the top. Various technical analysis indicators have generated upside signals. Further growth of quotations is possible in case of bad weather and a reduction in world yield.
- The Parabolic indicator demonstrates signal to increase.
- The Bolinger bands narrowed, indicating volatility decrease. Both lines of Bollinger have a slope up
- The RSI indicator is above the 50 mark. It has formed a divergence to the rise.
- The MACD indicator shows an uptrend signal.
The bullish momentum may develop if Cocoa exceeds the resistance line of the long-term neutral trend: 2450. This level can be used as an entry point. The initial stop loss may be placed below the last lower fractal, the Parabolic signal, the 200-day moving average line and the lower Bollinger line: 2222. After opening the pending order, we shall move the stop to the next fractal low following the Bollinger and Parabolic signals to the next fractal minimum. Thus, we are changing the potential profit/loss to the breakeven point. More risk-averse traders may switch to the 4-hour chart after the trade and place there a stop loss moving it in the direction of the trade. If the price meets the stop level (2222) without reaching the order (2450), we recommend to close the position: the market sustains internal changes that were not taken into account.
Technical Analysis Summary
| Position | Buy |
| Buy stop | Above 2450 |
| Stop loss | Below 2222 |
- Zertifikat erhalten

Hinweis:
Diese Übersicht hat einen informativen und Tutorencharakter und wird kostenlos veröffentlicht. Alle Daten, die in dieser Übersicht eingeschlossen sind, sind von mehr oder weniger zuverlässigen öffentlichen Quellen erhalten. Außerdem gibt es keine Garantie, dass die angezeigte Information voll und genau ist. Die Übersichten werden nicht aktualisiert. Die ganze Information in jeder Übersicht, einschließlich Meinungen, Hinweise, Charts und alles andere, werden nur für Vertrautmachen veröffentlicht und sind keine Finanzberatung oder Empfehlung. Der ganze Text und sein jeder Teil sowie die Charts können nicht als ein Geschäftsangebot betrachtet werden. Unter keinen Umständen sind IFC Markets und seine Angestellten für die Handlungen, die von jemand anderem während oder nach dem Lesen der Übersicht genommen werden, verantwortlich.
