- Analytik
- Technische Analyse
Erdgas Technische Analyse - Erdgas Handel: 2019-01-16
Cold snap is expected in the US
U.S. National Weather Service forecasts cold snap in the United States. Will natural gas prices rise?
The growth of natural gas prices may be due to an increase in demand for heating amid cold weather. Let us not that the volume of trades of natural gas on the New York Mercantile Exchange updated the historical high in November-December 2018. This may indicate an increase in liquidity. The beginning of cold snap in the US is expected on January 19 and it can last several weeks. According to forecasts, the demand for natural gas may increase next week to 125.9 billion cubic feet per day from 116.5 billion cubic feet per day in the current week. Gas supply in the US should amount to 95.6 billion cubic feet per day. The difference between supply and demand will be covered at the expense of reserves. According to the U.S. Energy Information Administration, at the beginning of this week, they amounted to 2.614 trillion cubic feet in the US, which is 15% less than the average level for the last 5 years. Data on US gas reserves are published weekly on Thursdays and may affect the dynamics of Natgas prices.
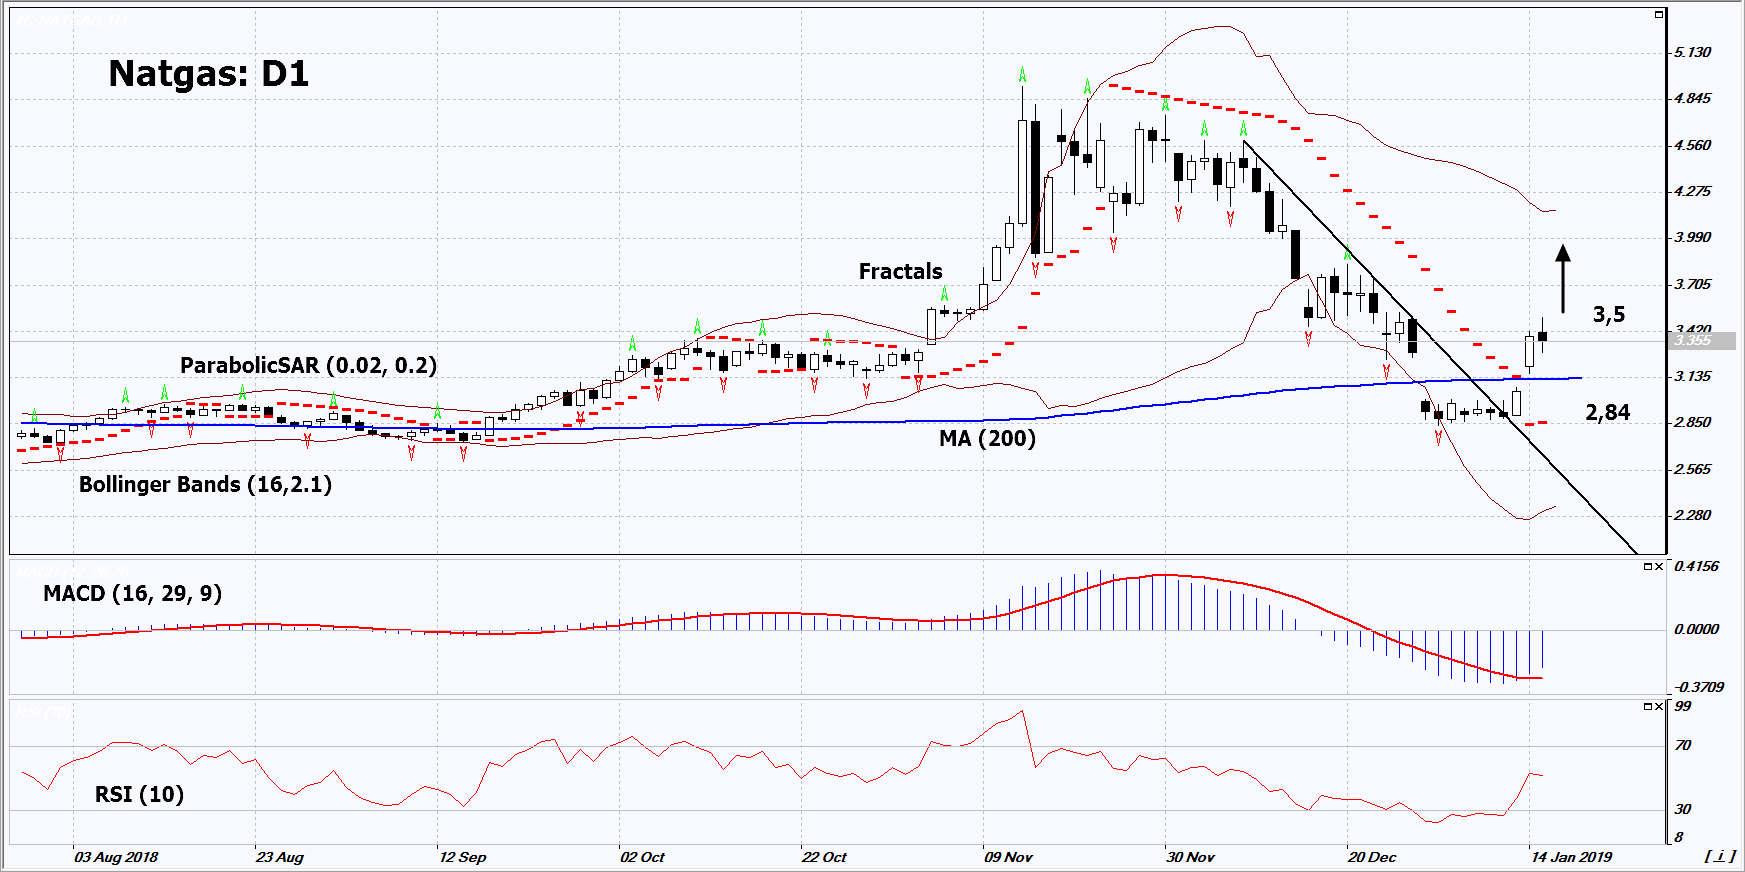
On the daily timeframe, Natgas: D1 has breached up the resistance line of the downtrend and is correcting upwards. A number of technical analysis indicators formed buy signals. The further price growth is possible in case of an increase in demand amid cold snap in the US.
- The Parabolic indicator gives a bullish signal.
- The Bollinger bands have widened, which indicates high volatility. Both Bollinger bands are titled upwards.
- The RSI indicator is near 50. No divergence.
- The MACD indicator gives a bullish signal.
The bullish momentum may develop in case Natgas exceeds its last high at 3.5. This level may serve as an entry point. The initial stop loss may be placed below the last fractal low and the Parabolic signal at 2.84. After opening the pending order, we shall move the stop to the next fractal low following the Bollinger and Parabolic signals. Thus, we are changing the potential profit/loss to the breakeven point. More risk-averse traders may switch to the 4-hour chart after the trade and place there a stop loss moving it in the direction of the trade. If the price meets the stop level (2.84) without reaching the order (3.5), we recommend to close the position: the market sustains internal changes that were not taken into account.
Summary of technical analysis
| Position | Buy |
| Buy stop | Above 3.5 |
| Stop loss | Below 2.84 |
Explore our
Trading Conditions
- Spreads from 0.0 pip
- 30,000+ Trading Instruments
- Instant Execution
Ready to Trade?
Open Account Hinweis:
Diese Übersicht hat einen informativen und Tutorencharakter und wird kostenlos veröffentlicht. Alle Daten, die in dieser Übersicht eingeschlossen sind, sind von mehr oder weniger zuverlässigen öffentlichen Quellen erhalten. Außerdem gibt es keine Garantie, dass die angezeigte Information voll und genau ist. Die Übersichten werden nicht aktualisiert. Die ganze Information in jeder Übersicht, einschließlich Meinungen, Hinweise, Charts und alles andere, werden nur für Vertrautmachen veröffentlicht und sind keine Finanzberatung oder Empfehlung. Der ganze Text und sein jeder Teil sowie die Charts können nicht als ein Geschäftsangebot betrachtet werden. Unter keinen Umständen sind IFC Markets und seine Angestellten für die Handlungen, die von jemand anderem während oder nach dem Lesen der Übersicht genommen werden, verantwortlich.
