- Analytik
- Technische Analyse
Sojabohnen Technische Analyse - Sojabohnen Handel: 2019-12-27
Higher Chinses imports bullish for soybean price
China has increased US soybeans purchases recently. Will the soybean prices continue rising?
China has increased purchases of United States soybeans last month. China bought 2.56 million tons of US soybeans in November, compared to no purchases at all a year ago and 1.147 million tons in October. Purchases of Chinese buyers increased in last couples of months after Beijing issued tariff-free quotas in a goodwill gesture to Washington. And purchases from Brazil fell 24% from 5.07 million tons in November last year. Higher export demand is bullish for soybean prices. At the same time smaller Chinese pig herds after African swine fever disease decimated China’s massive pig herd is a downside risk, However Chinses officials report country’s pig herd has started to recover in recent months.
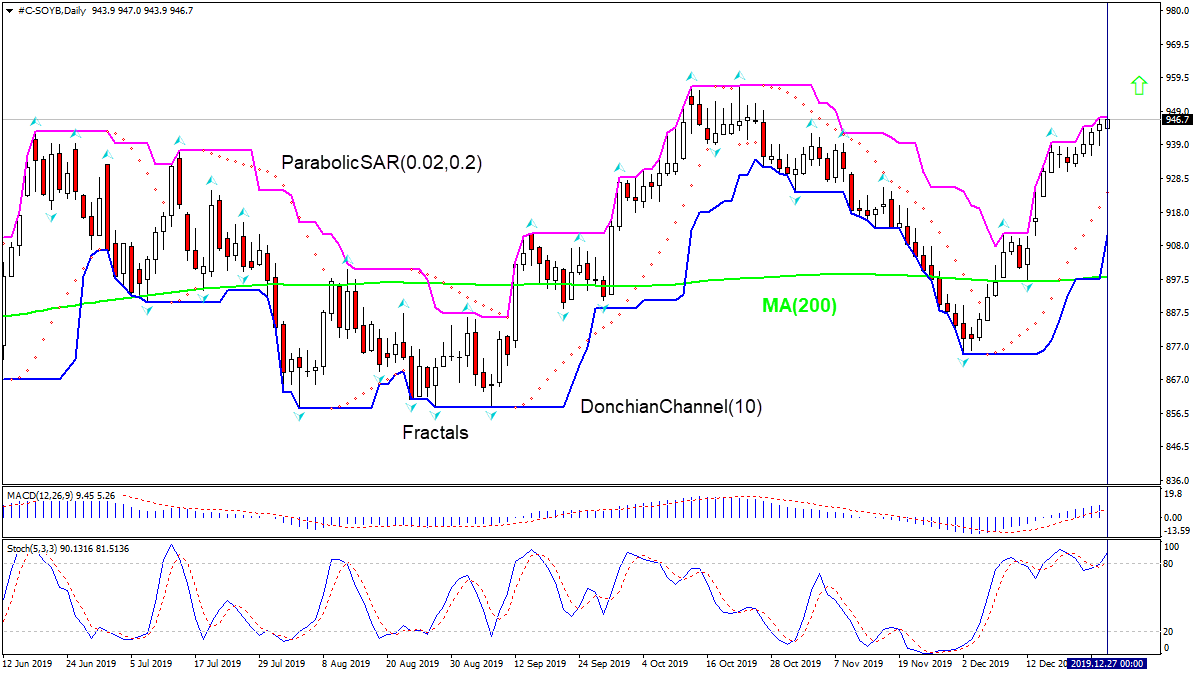
On the daily timeframe the SOYB: D1 is rising above the 200-day moving average MA(200), which is rising too.
- The Parabolic indicator gives a buy signal.
- The Donchian channel indicates uptrend: it is narrowing up.
- The MACD indicator gives a bullish signal: it is above the signal line and the gap is widening.
- The Stochastic oscillator has breached into overbought zone, this is bearish.
We believe the bullish momentum will continue after the price breaches above the upper boundary of Donchian channel at 947.3. This level can be used as an entry point for placing a pending order to buy. The stop loss can be placed below the last Parabolic signal at 924.2. After placing the order, the stop loss is to be moved every day to the next fractal low, following Parabolic signals. Thus, we are changing the expected profit/loss ratio to the breakeven point. If the price meets the stop loss level (924.2) without reaching the order (947.3), we recommend cancelling the order: the market has undergone internal changes which were not taken into account.
Technical Analysis Summary
| Order | Buy |
| Buy stop | Above 947.3 |
| Stop loss | Below 924.2 |
Explore our
Trading Conditions
- Spreads from 0.0 pip
- 30,000+ Trading Instruments
- Stop Out Level - Only 10%
Ready to Trade?
Open Account Hinweis:
Diese Übersicht hat einen informativen und Tutorencharakter und wird kostenlos veröffentlicht. Alle Daten, die in dieser Übersicht eingeschlossen sind, sind von mehr oder weniger zuverlässigen öffentlichen Quellen erhalten. Außerdem gibt es keine Garantie, dass die angezeigte Information voll und genau ist. Die Übersichten werden nicht aktualisiert. Die ganze Information in jeder Übersicht, einschließlich Meinungen, Hinweise, Charts und alles andere, werden nur für Vertrautmachen veröffentlicht und sind keine Finanzberatung oder Empfehlung. Der ganze Text und sein jeder Teil sowie die Charts können nicht als ein Geschäftsangebot betrachtet werden. Unter keinen Umständen sind IFC Markets und seine Angestellten für die Handlungen, die von jemand anderem während oder nach dem Lesen der Übersicht genommen werden, verantwortlich.
