- Analyses
- Analyse technique
ASX 200 Analyse technique - ASX 200 Trading: 2018-05-22
Les actions sont en cours de correction dans des matières premières moins chères
Stock prices of the Australian mining companies fell following the decline in iron ore prices in China. Will S&P/ASX 200 prices fall?
The share of commodity companies in the index is 18%. On Monday, iron ore prices on the Dalian Commodity Exchange fell by more than 3% to 462 yuan ($ 72.29) per ton. The reduction in demand for ferrous metallurgy products is explained by the beginning of the rainy season in southern China and, as a result, a decrease in activity in construction. It is difficult to say whether there are more convincing reasons for the decrease in steel and iron ore prices, but, perhaps, trade disagreements between China and the United States had a negative impact. An additional negative for the S&P/ASX 200 stock index may be the growth of unemployment rate in Australia in April, the decrease in retail sales for the first quarter of 2018, as well as the emerging strengthening of the Australian dollar.
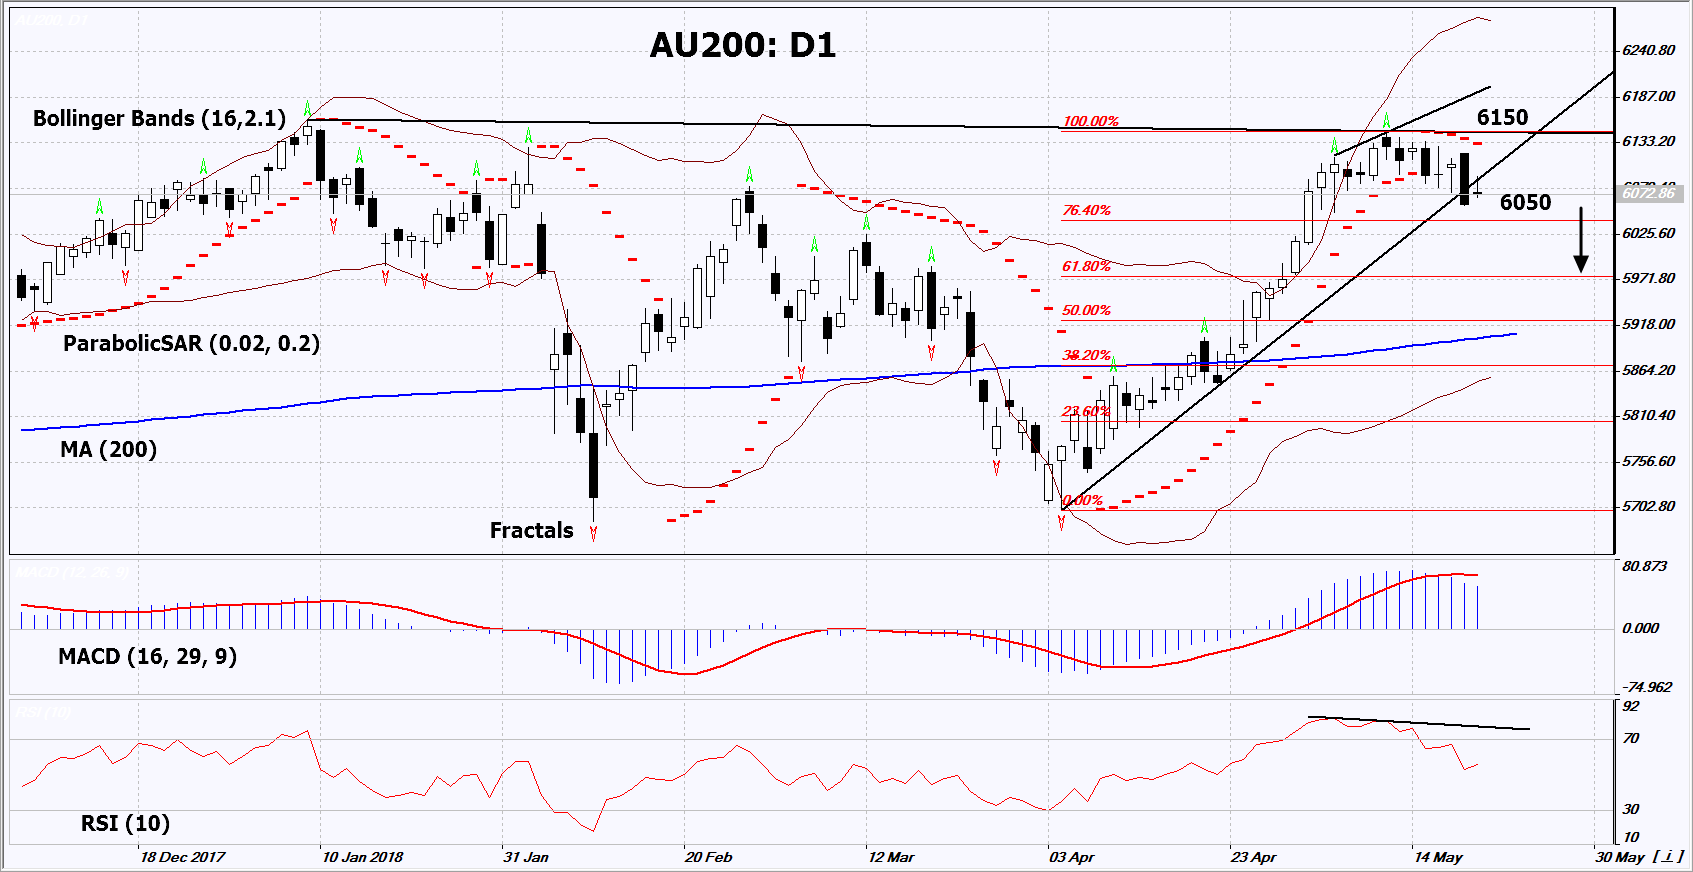
On the daily timeframe, AU200: D1 breached down the support line of the uptrend. Negative economic and corporate news may contribute to the reduction of prices.
- The Parabolic indicator gives a bearish signal.
- The Bollinger bands have widened, which indicates high volatility. The upper band is titled down.
- The RSI indicator is above 50. It has formed a negative divergence.
- The MACD indicator gives bearish signals.
The bearish momentum may develop in case AU200 falls below its last low at 6050. This level may serve as an entry point. The initial stop loss may be placed above the last fractal high, the 4-year high and the Parabolic signal at 6150. After opening the pending order, we shall move the stop to the next fractal high following the Bollinger and Parabolic signals. Thus, we are changing the potential profit/loss to the breakeven point. More risk-averse traders may switch to the 4-hour chart after the trade and place there a stop loss moving it in the direction of the trade. If the price meets the stop level at 6150 without reaching the order at 6050, we recommend to close the position: the market sustains internal changes that were not taken into account.
Summary of technical analysis
| Position | Sell |
| Sell stop | Below 6050 |
| Stop loss | Above 6150 |
- Obtenir un certificat

NB:
Cet aperçu a un caractère instructif et didactique, publié gratuitement. Toutes les données, comprises dans l'aperçu, sont reçues de sources publiques, reconnues comme plus ou moins fiables. En outre, rien ne garantit que les informations indiquées sont complètes et précises. Les aperçus ne sont pas mis à jour. L'ensemble de l'information contenue dans chaque aperçu, y compris l'opinion, les indicateurs, les graphiques et tout le reste, est fourni uniquement à des fins de familiarisation et n'est pas un conseil financier ou une recommandation. Tout le texte entier et sa partie, ainsi que les graphiques ne peuvent pas être considérés comme une offre de faire une transaction sur chaque actif. IFC Markets et ses employés, dans n'importe quelle circonstance, ne sont pas responsables de toute action prise par quelqu'un d'autre pendant ou après la lecture de l’aperçu.
