- Analisi
- Analisi Tecnica
Brent vs Ruble Analisi Tecnica - Brent vs Ruble Trading: 2021-03-23
Brent RUB Technical Analysis Summary
Sotto 5330
Sell Stop
Sopra 4750
Stop Loss
| Indicator | Signal |
| RSI | Sell |
| MACD | Sell |
| MA(200) | Neutro |
| Fractals | Neutro |
| Parabolic SAR | Sell |
| Bollinger Bands | Neutro |
Brent RUB Chart Analysis
Brent RUB Analisi Tecnica
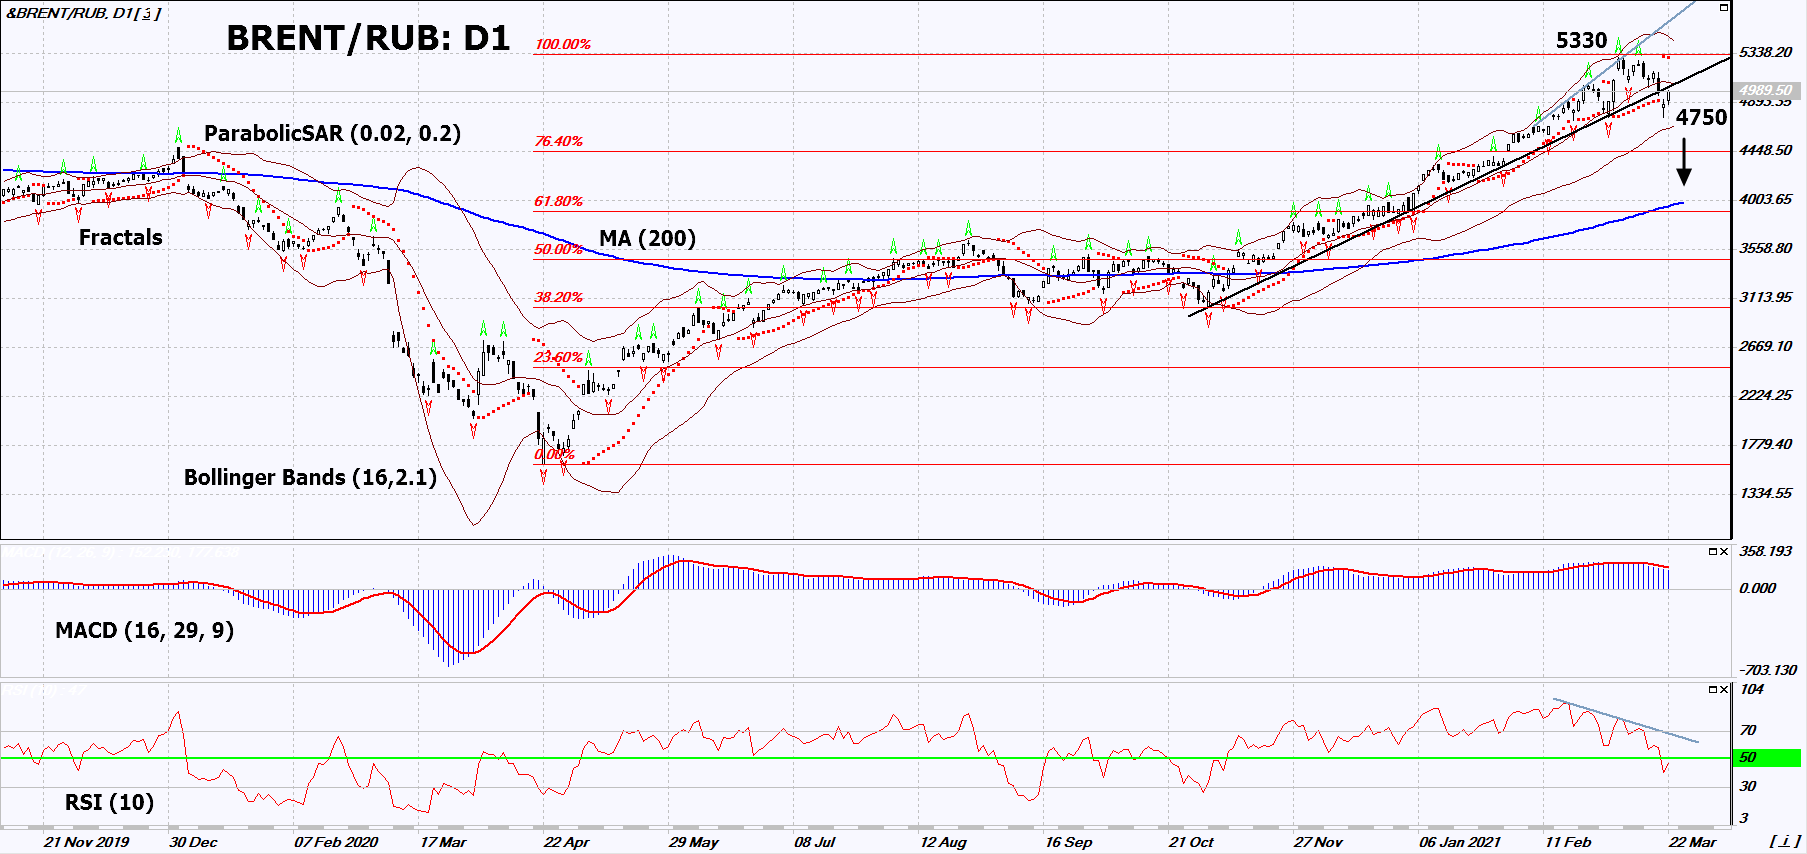
On the daily timeframe, BRENT/RUB: D1 breached down the uptrend support line. A number of technical analysis indicators formed signals for a further drop. We do not exclude a bearish move if BRENT/RUB falls below the last low: 4750. This level can be used as an entry point. We can place a stop loss above the high since October 2018 and the Parabolic signal: 5330. After opening the pending order, we can move the stop loss following the Bollinger and Parabolic signals to the next fractal maximum. Thus, we change the potential profit/loss ratio in our favor. After the transaction, the most risk-averse traders can switch to the four-hour chart and set a stop loss, moving it in the direction of the bias. If the price meets the stop loss (5330) without activating the order (4750), it is recommended to delete the order: the market sustains internal changes that have not been taken into account.
Analisi Fondamentale PCI - Brent RUB
In this review, we suggest considering the "BRENT vs the Ruble" personal composite instrument (PCI). It reflects the dynamics of changes in the cost of a Brent barrel against the Russian currency. Will the BRENT/RUB quotes go down?
PCI declines when oil gets cheaper and the ruble strengthens against the US dollar and, on the contrary, it grows when oil prices rise while the ruble weakens. By contrast, the Russian currency tends to strengthen at high oil prices and weaken at low oil prices. Because of this, BRENT/RUB quotes usually fluctuate around their long-term, 200-day moving average. Now they have deviated noticeably from it. In other words, the ruble remains weak against the US dollar despite strong growth in world oil prices. Recall that the all-time high of this PCI was at 5909 in October 2018. Now it is below this level, but at the same time, it breached down the upward trend line. PCI fluctuations around the moving average are due to the Russian export structure. According to Russian Customs statistics, the share of fuel and energy products exported from Russia to non-CIS countries in 2020 amounted to 53.8% (66.9% in January-December 2019). The slight decrease is due to the drop in world oil prices because of the coronavirus pandemic.
Explore our
Trading Conditions
- Spreads from 0.0 pip
- 30,000+ Trading Instruments
- Stop Out Level - Only 10%
Ready to Trade?
Open Account Note:
Questa panormaica è di carattere informativo-educativo e viene pubblicata gratuitamente. Tutti i dati compresi nella panoramica sono ottenuti da fonti pubbliche conosciute più o meno affidabili. Inoltre non c'è alcuna garanzia che le informazioni fornite siano precise e complete. Le panoramiche non vengono aggiornate. Tutta l'informazione in ciascuna panoramica, compresi indicatori, opinioni, grafici e o quant'altro, è fornita a scopo conoscitivo e non è un consiglio finanziario. Tutto il testo e qualsiasi delle sue parti, e anche i grafici non possono essere considerati un'offerta per effettuare un'operazione con un qualsiasi asset. IFC Markets e i suoi impiegati in alcun caso non sono responsabili per qualsiasi azione intrapresa sulla base delle informazioni contenute.

