- 분석
- 기술적 분석
Gold vs Silver 기술적 분석 - Gold vs Silver 거래: 2019-07-17
Silver rises in price against gold
The gold to silver ratio is adjusted down from the historical maximum. Will the decline of XAUXAG quotations continue?
Such dynamics is observed when gold becomes cheaper, and silver becomes more expensive. The cost of gold fell against the strengthening of the dollar after the publication of good macroeconomic indicators in the United States. Growth in retail sales in June exceeded forecasts and amounted to + 0.4% compared with June. Year to year, retail sales grew by 3.4%. Positive US statistics may limit the potential rate cut by the Fed. Silver quotations, on the contrary, soared yesterday a 4-month high. Some very important reasons for this growth have not been voiced. However, it can be noted that for 10 years the world balance of silver has a stable annual deficit, covered by global reserves. So, in 2018, the global deficit was 80 million ounces. In addition, investors have noted an increase in demand for investment coins and silver bars against the background of sharply rising gold.
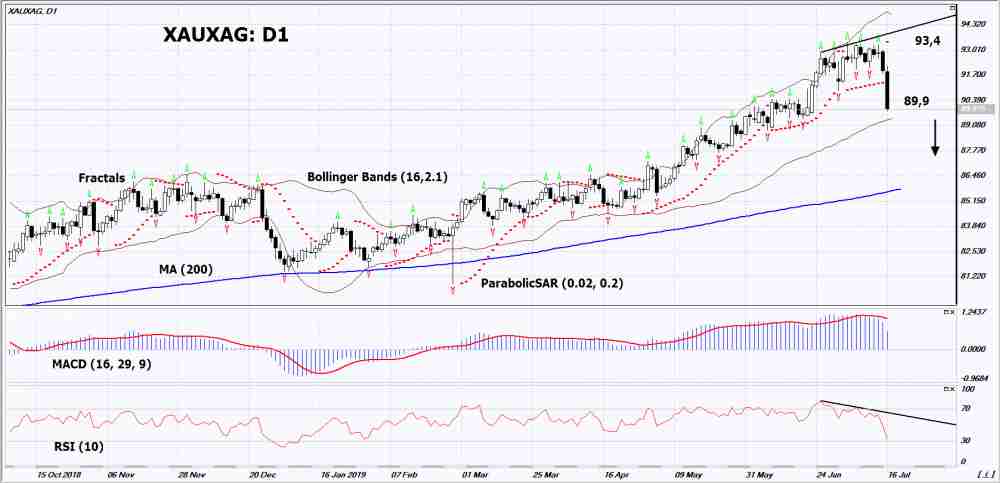
On the daily timeframe XAUXAG: D1 adjusted from the historical maximum. Various technical analysis indicators formed bearish signal. Decrease in quotations is possible if high demand for silver remains.
- The Parabolic indicator indicates signal to decrease.
- The Bolinger bands expanded, indicating a volatility decrease. The top line slopes down.
- The RSI indicator is below 50. It has formed a divergence to decrease.
- The MACD indicator gives bearish signal.
The bearish momentum may develop if XAUXAG drops below its last low: 89.9. This level can be used as an entry point. The initial stop lose may be placed above the last three upper fractals, the historical maximum and the Parabolic signal: 93.4. After opening the pending order, stop shall be moved following the the Bollinger and Parabolic signals to the next fractal minimum. Thus, we are changing the potential profit/loss to the breakeven point. More risk-averse traders may switch to the 4-hour chart after the trade and place a stop loss moving it in the direction of the trade. If the price meets the stop level (93,4) without reaching the order (89,9), we recommend to cancel the order: the market sustains internal changes that were not taken into account.
Technical Analysis Summary
| Position | Sell |
| Sell stop | Below 89,9 |
| Stop loss | Above 93,4 |
- 인증서 받기

Note:
해당 개요는 유익하고 튜토리얼적인 성격을 가지고 있으며 무료로 게시됩니다. 이 개요에 포함된 모든 데이터는 어느 정도 신뢰할 수 있는 것으로 간주되는 오픈 소스에서 받은 것입니다. 또한 표시된 정보가 완전하고 정확하다는 보장이 없습니다. 개요가 업데이트되지 않습니다. 의견, 인디케이터, 차트 및 기타 항목을 포함하여 각 개요의 전체 정보는 이해의 목적으로만 제공되며 재정적 조언이나 권장 사항이 아닙니다. 전체 텍스트와 그 일부, 차트는 자산과의 거래 제안으로 간주될 수 없습니다. IFC Markets와 그 직원은 어떤 상황에서도 개요를 읽는 동안 또는 읽은 후에 다른 사람이 취한 행동에 대해 책임을 지지 않습니다.
