- 분석
- 기술적 분석
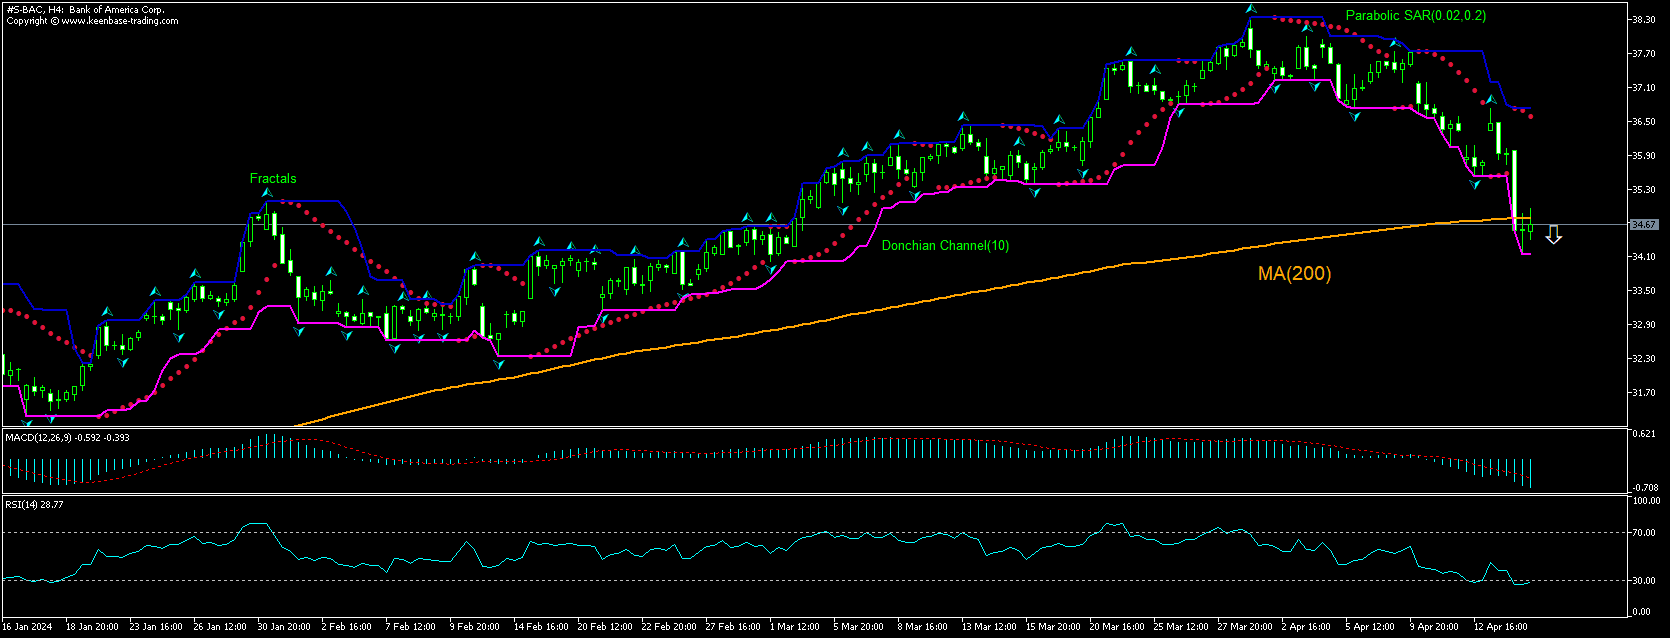
Bank of America 기술적 분석 - Bank of America 거래: 2024-04-17
Bank of America 기술적 분석 요약
아래에 34.14
Sell Stop
위에 36.73
Stop Loss
| 인디케이터 | 신호 |
| RSI | 구매 |
| MACD | 판매 |
| Donchian Channel | 중립적 |
| MA(200) | 판매 |
| Fractals | 판매 |
| Parabolic SAR | 판매 |
Bank of America 차트 분석
Bank of America 기술적 분석
The technical analysis of the Bank of America stock price chart on 4-hour timeframe shows #S-BAC,H4 has fallen under the 200-period moving average MA(200) which is rising itself. The RSI is about to leave the oversold zone. We believe the bearish momentum will continue after the price breaches below the lower boundary of Donchian channel at 34.14. This level can be used as an entry point for placing a pending order to sell. The stop loss can be placed above the fractal high at 36.73. After placing the order, the stop loss is to be moved every day to the next fractal high, following Parabolic indicator signals. Thus, we are changing the expected profit/loss ratio to the breakeven point. If the price meets the stop loss level (36.73) without reaching the order (34.14), we recommend cancelling the order: the market has undergone internal changes which were not taken into account.
지수 - Bank of America 기본 분석
Bank of America stock fell after the company reported better than expected revenue and earnings. Will the Bank of America stock price continue retreating?
Bank of America beat first quarter revenue and earnings estimates yesterday but the stock ended 3.5% lower for the day. The bank reported revenue of $25.82 billion, exceeding the Wall Street consensus estimate of $25.46 billion. However the revenue was down 2% year over year as higher investment banking and trading revenues were unable to offset lower net interest income. Bank of America reported a 18% drop in first-quarter profit as the bank reported higher expenses and charge-offs of bad loans that exceeded expectations. Charge-offs for bad loans totaled $1.5 billion, up 26% from the final three months of 2023 and significantly above the $1.26 billion analysts had expected. The company attributed the higher-than-expected charge-off number to an increase in credit card issues, but stated that the number is flattening out. The bank stated that its unrealized losses on a $587 billion portfolio of bonds that are classified as held to maturity for accounting purposes widened by $11 billion to $109 billion on March 31 from $98 billion at year-end 2023. Bank of America has by far the largest bond losses in the banking industry.
Note:
해당 개요는 유익하고 튜토리얼적인 성격을 가지고 있으며 무료로 게시됩니다. 이 개요에 포함된 모든 데이터는 어느 정도 신뢰할 수 있는 것으로 간주되는 오픈 소스에서 받은 것입니다. 또한 표시된 정보가 완전하고 정확하다는 보장이 없습니다. 개요가 업데이트되지 않습니다. 의견, 인디케이터, 차트 및 기타 항목을 포함하여 각 개요의 전체 정보는 이해의 목적으로만 제공되며 재정적 조언이나 권장 사항이 아닙니다. 전체 텍스트와 그 일부, 차트는 자산과의 거래 제안으로 간주될 수 없습니다. IFC Markets와 그 직원은 어떤 상황에서도 개요를 읽는 동안 또는 읽은 후에 다른 사람이 취한 행동에 대해 책임을 지지 않습니다.


