- 분석
- 기술적 분석
LTCUSD 기술적 분석 - LTCUSD 거래: 2025-06-30
LTCUSD 기술적 분석 요약
위에 88.09
Buy Stop
아래에 91.39
Stop Loss
| 인디케이터 | 신호 |
| RSI | 중립적 |
| MACD | 구매 |
| MA(200) | 판매 |
| Fractals | 구매 |
| Parabolic SAR | 구매 |
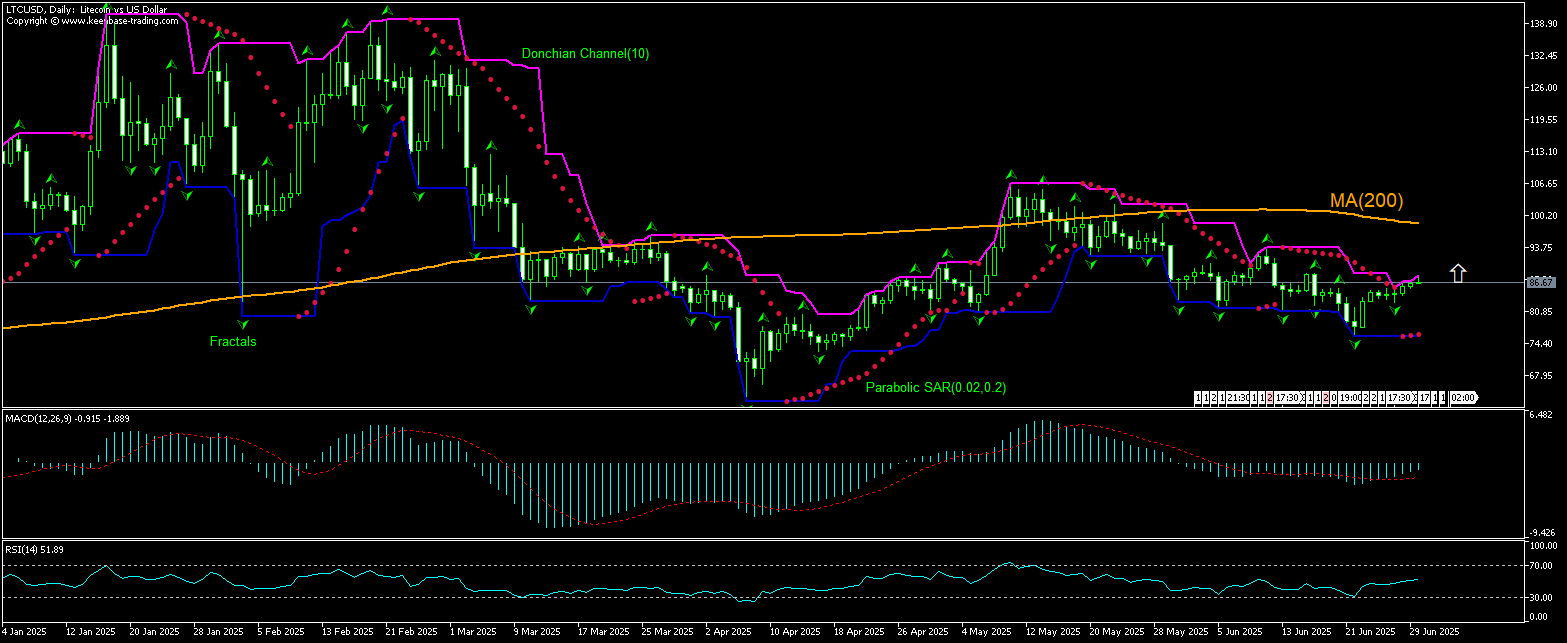
LTCUSD 차트 분석
LTCUSD 기술적 분석
The LTCUSD technical analysis of the price chart on daily timeframe shows LTCUSD,Daily is rebounding toward the 200-period moving average MA(200) after hitting 9-week low eight days ago. We believe the bullish momentum will continue after the price breaches above the upper boundary of Donchian channel at 88.09. A level above this can be used as an entry point for placing a pending order to buy. The stop loss can be placed below 81.39. After placing the order, the stop loss is to be moved to the next fractal low , following Parabolic indicator signals. Thus, we are changing the expected profit/loss ratio to the breakeven point. If the price meets the stop loss level without reaching the order, we recommend cancelling the order: the market has undergone internal changes which were not taken into account.
암호화 - LTCUSD 기본 분석
LTCUSD is attempting a rebound as traders bet on LTC ETF approval. Will the LTCUSD price rebound continue?
Litecoin (LTC) rose almost 9% last week as traders anticipate a regulatory boost: the U.S. Securities and Exchange Commission is reviewing two bids for a spot Litecoin ETF. Couple of weeks ago Bloomberg analyst Seyffart estimated the chances for a Litecoin spot ETF being greenlighted this year stand at 90%. Polymarket traders assign an 83% chance to SEC approval of a LTC ETF this year. A green light to such a fund this year would open LTC exposure to investors betting on crypto through traditional brokerages. Expectations of a LTC ETF approval by SEC are bullish for LTCUSD price.
Explore our
Trading Conditions
- Spreads from 0.0 pip
- 30,000+ Trading Instruments
- Instant Execution
Ready to Trade?
Open Account Note:
해당 개요는 유익하고 튜토리얼적인 성격을 가지고 있으며 무료로 게시됩니다. 이 개요에 포함된 모든 데이터는 어느 정도 신뢰할 수 있는 것으로 간주되는 오픈 소스에서 받은 것입니다. 또한 표시된 정보가 완전하고 정확하다는 보장이 없습니다. 개요가 업데이트되지 않습니다. 의견, 인디케이터, 차트 및 기타 항목을 포함하여 각 개요의 전체 정보는 이해의 목적으로만 제공되며 재정적 조언이나 권장 사항이 아닙니다. 전체 텍스트와 그 일부, 차트는 자산과의 거래 제안으로 간주될 수 없습니다. IFC Markets와 그 직원은 어떤 상황에서도 개요를 읽는 동안 또는 읽은 후에 다른 사람이 취한 행동에 대해 책임을 지지 않습니다.

