- Analytics
- Technical Analysis
Cotton Technical Analysis - Cotton Trading: 2015-10-14
Markets concerned by probable cotton deficit
The cotton prices hit the high of three weeks after the US Department of Agriculture (USDA) its production forecast. The additional factor contributing to price growth is the farmers strike in Pakistan. The cotton chart has formed the channel tilted upwards. Will the price reach the upper channel line?
In October report USDA has the US cotton production forecast in 2015/16 to 13.34mln bags of 480 pounds each from 13.43mln in September report. The estimation of future cotton yield in India was also revised down from 29mln bags to 28.5mln due to the scanty rainfall. Some market participants state that the US farmers are holding their cotton awaiting higher prices. The current prices are just 9% higher the 6-year low of 57.54 and are threefold lower the high of 2011.
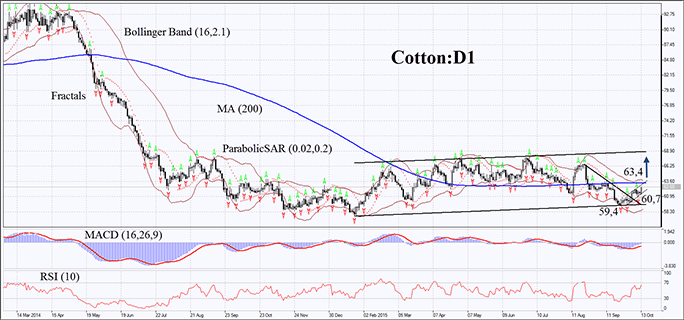
On the daily chart, COTTON:D1 is moving up within the formed ascending price channel. On Tuesday it has surpassed the last Bill Williams fractals high. The MACD and Parabolic indicators give the buy signals. RSI is above 50 but has not yet reached the overbought zone.The Bollinger Bands are contracting which may signify lower volatility. The bullish momentum can develop in case the cotton prices surpass the 200-day moving average line and the upper Bollinger Band. Their breakout can serve the point of entry at 63.4. The initial risk limit is possible below the Parabolic indicator signal and the last fractal low at 60.7. The lower price channel line and the third fractal low at 59.4 can be used for placing stop loss. Having opened the pending order we shall move the stop to the next fractal low following the Parabolic and Bollinger signals every 4 hours. Thus, we are changing the probable profit/loss ratio to the breakeven point. The most risk-averse traders may switch to the 4-hour chart after the trade and place there a stop-loss moving it in the direction of the trade. If the price meets the stop-loss level at 60.7 or 59.4 without reaching the order at 63.4, we recommend cancelling the position: the market sustains internal changes which were not taken into account.
| Position | Buy |
| Buy stop | above 63,4 |
| Stop loss | below 60,7 or 59,4 |
Explore our
Trading Conditions
- Spreads from 0.0 pip
- 30,000+ Trading Instruments
- Stop Out Level - Only 10%
Ready to Trade?
Open Account Note:
This overview has an informative and tutorial character and is published for free. All the data, included in the overview, are received from public sources, recognized as more or less reliable. Moreover, there is no guarantee that the indicated information is full and precise. Overviews are not updated. The whole information in each overview, including opinion, indicators, charts and anything else, is provided only for familiarization purposes and is not financial advice or а recommendation. The whole text and its any part, as well as the charts cannot be considered as an offer to make a deal with any asset. IFC Markets and its employees under any circumstances are not liable for any action taken by someone else during or after reading the overview.
