- Analytics
- Technical Analysis
SUGAR Technical Analysis - SUGAR Trading: 2016-10-17
Brazil raises sugar production
Sugarcane industry association Unica said Brazil increased sugar production in 2nd half of September to 2.95mln tonnes from 2.41mln tonnes in 1st half of September. Will it trigger downward correction of global sugar prices? There are many additional factors.
Sugar prices hit a fresh 4-year high two weeks ago. Amid this, Brazilian sugar plants sold sugar futures as on the end of September in the amount of 7.17mln tonnes at ICE exchange. This is 27% form the anticipated exports of Brazil in 2017/18 agricultural season. Just 19.7% of total exports were sold on the same date of previous season. High sugar prices stimulate Brazilian plants to increase not only sales but production also. The share of sugar cane used to produce ethanol (biofuel) has fallen to 49.8% from 57.5% in the same period of last year. So, cane processing into sugar rose to 50.2% from 42.5%.
Chinese government began to gauge whether possible rise in sugar delivery from Brazil may hurt local farmers. In response, Brazil’s sugarcane industry association Unica said on Friday there is no cause for it. Previously USDA raised the US cane production forecast in 2016/17 season by 155thousand tonnes to 9.4thousand tonnes from its previous forecast. This is the record high since 1960. However, stockpiles/consumption ratio rose to 14.4 from 13.5 in previous month. USDA also expects the sugar import to US to rise by 26 thousand to 2.7mln tonnes as Mexico revised quota.
Ukraine is planning to increase sugar export in 2016 to 250 thousand tonnes from 114.8 thousand tonnes in 2015. Its export supplies rose this September by 21% compared to August and reached 40 thousand tonnes. Russia cut sugar purchases in global market to 226.6 thousand tonnes in first 8 months of 2016 from 476.8 thousand tonnes in the same period of 2015.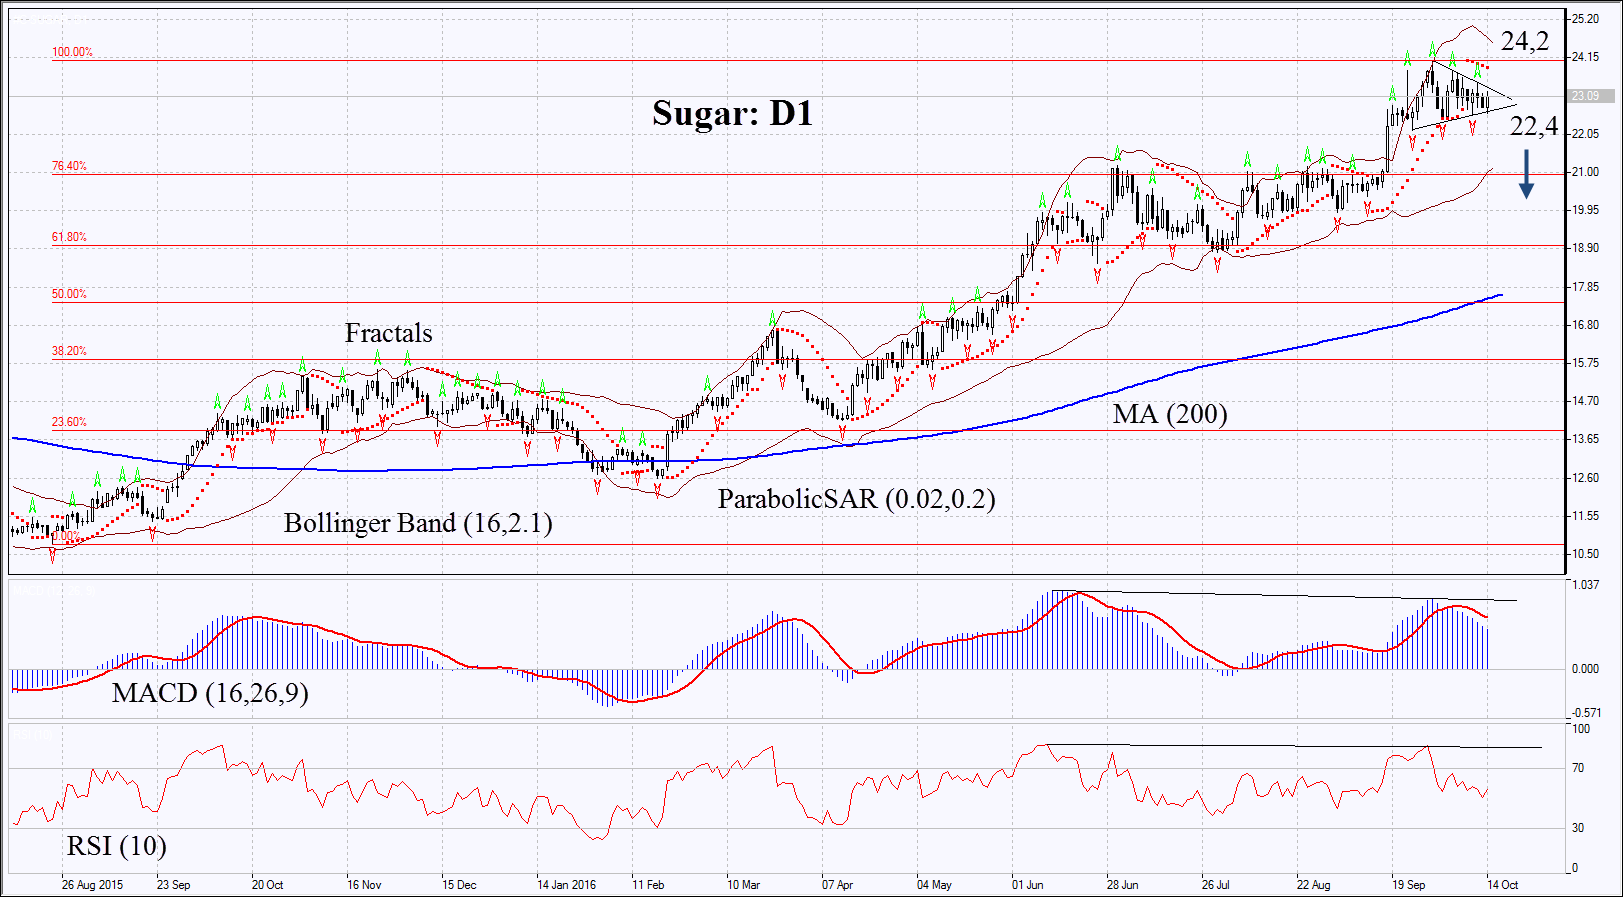
On the daily chart Sugar: D1 has advanced 54% since the start of 2016. In recent 2 weeks it is consolidating within the triangle. The downward correction is possible in case sugar prices rise in Brazil and US and if imports to China fall.
- Parabolic is giving bearish signals.
- Bollinger bands have narrowed a bit which means slightly lower volatility. They are tilted downwards.
- RSI is near 50, no divergence.
- MACD is giving bearish signals.
The bearish momentum may develop in case Sugar prices fall below the support of triangle and two last fractal lows at 22.4. This level may serve the point of entry. The initial stop-loss may be placed above the 4-year high at 24.2. Having opened the pending order we shall move the stop to the next fractal high following the Parabolic and Bollinger signals. Thus, we are changing the probable profit/loss ratio to the breakeven point. The most risk-averse traders may switch to the 4-hour chart after the trade and place there a stop-loss moving it in the direction of the trade. If the price meets the stop-loss level at 24.2 without reaching the order at 22.4, we recommend cancelling the position: the market sustains internal changes which were not taken into account.
Summary of technical analysis
| Position | Sell |
| Sell stop | below 22.4 |
| Stop loss | above 24.2 |
Explore our
Trading Conditions
- Spreads from 0.0 pip
- 30,000+ Trading Instruments
- Stop Out Level - Only 10%
Ready to Trade?
Open Account Note:
This overview has an informative and tutorial character and is published for free. All the data, included in the overview, are received from public sources, recognized as more or less reliable. Moreover, there is no guarantee that the indicated information is full and precise. Overviews are not updated. The whole information in each overview, including opinion, indicators, charts and anything else, is provided only for familiarization purposes and is not financial advice or а recommendation. The whole text and its any part, as well as the charts cannot be considered as an offer to make a deal with any asset. IFC Markets and its employees under any circumstances are not liable for any action taken by someone else during or after reading the overview.
