- Analytics
- Technical Analysis
USD JPY Technical Analysis - USD JPY Trading: 2015-02-23
Triangle breakout
Let’s consider the USD/JPY currency pair on the daily chart. The price broke the upper triangle side, having made a corrective reversal. This signal may be regarded as the bullish trend expansion. At the moment the daily uptrend showed a higher peak and trough, which are confirmed by Parabolic points and Donchian Channel boundaries. This might suggest that both levels are significant enough.
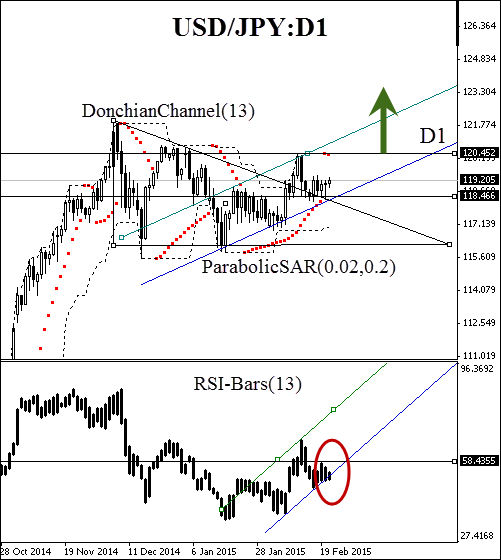
| Position | Buy |
| Buy stop | above 120.452 |
| Stop loss | below 118.466 |
- Get Certificate

Note:
This overview has an informative and tutorial character and is published for free. All the data, included in the overview, are received from public sources, recognized as more or less reliable. Moreover, there is no guarantee that the indicated information is full and precise. Overviews are not updated. The whole information in each overview, including opinion, indicators, charts and anything else, is provided only for familiarization purposes and is not financial advice or а recommendation. The whole text and its any part, as well as the charts cannot be considered as an offer to make a deal with any asset. IFC Markets and its employees under any circumstances are not liable for any action taken by someone else during or after reading the overview.
