- 분석
- 기술적 분석
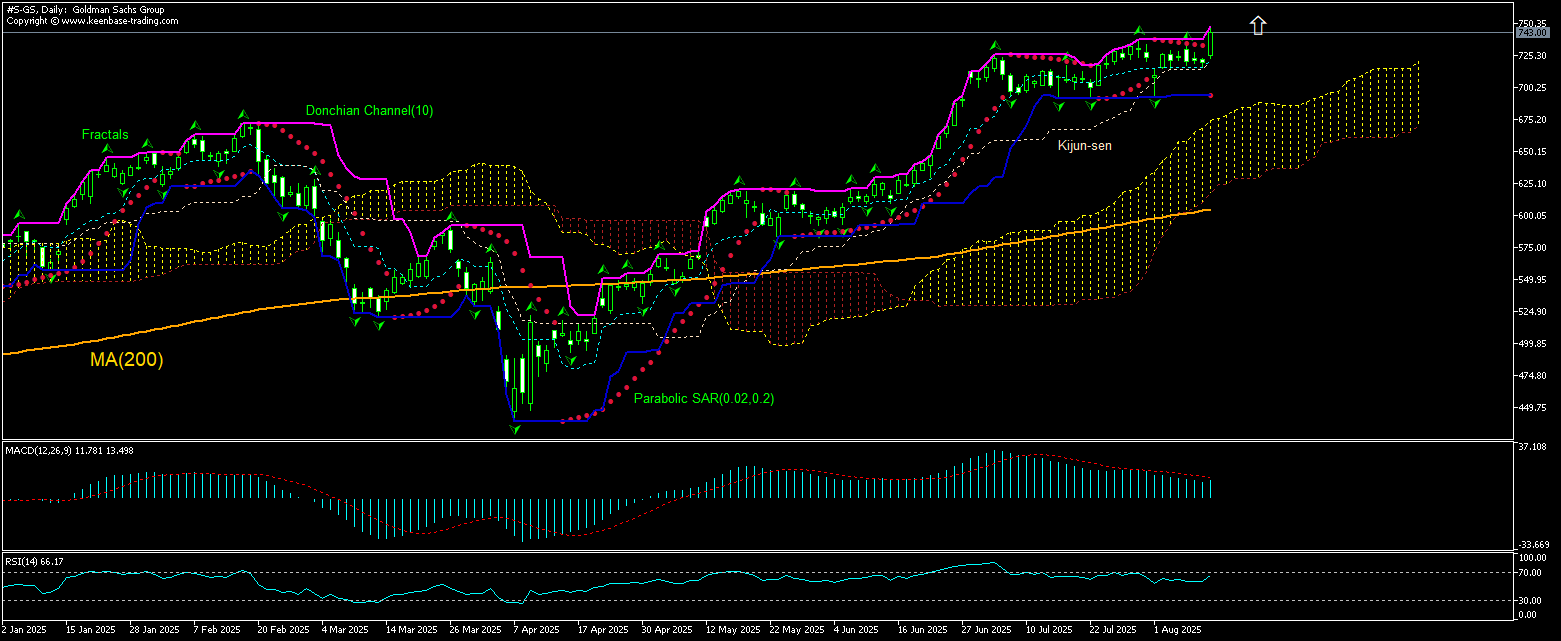
Goldman Sachs 기술적 분석 - Goldman Sachs 거래: 2025-08-13
Goldman Sachs 기술적 분석 요약
위에 747.83
Buy Stop
아래에 693.95
Stop Loss
| 인디케이터 | 신호 |
| RSI | 중립적 |
| MACD | 구매 |
| Donchian Channel | 구매 |
| MA(200) | 구매 |
| Fractals | 중립적 |
| Parabolic SAR | 구매 |
| Ichimoku Kinko Hyo | 구매 |
Goldman Sachs 차트 분석
Goldman Sachs 기술적 분석
The technical analysis of the Goldman Sachs stock price chart on daily timeframe shows #S-GS, Daily is advancing above the 200-day moving average MA(200) after returning above MA(200) 8 weeks ago. We believe the bullish momentum will continue after the price breaches above the upper boundary of Donchian channel at 747.83. This level can be used as an entry point for placing a pending order to buy. The stop loss can be placed below 693.95. After placing the order, the stop loss is to be moved every day to the next fractal high, following Parabolic indicator signals. Thus, we are changing the expected profit/loss ratio to the breakeven point. If the price meets the stop loss level (693.95) without reaching the order (747.83), we recommend cancelling the order: the market has undergone internal changes which were not taken into account.
지수 - Goldman Sachs 기본 분석
Goldman Sachs stock rose after the bank said it is raising its dividend. Will the Goldman Sachs stock price continue advancing?
The Goldman Sachs Group, Inc. is a global investment bank and financial services company with market capitalization at $225.0 billion. The company is active in four primary segments: Global Banking & Markets, Asset & Wealth Management, and Platform Solutions. The stock is trading at P/E ratio (Trailing Twelve Months) of 16.37 and Price/Sales ratio of 4.31 currently. The company earned $54.79 billion revenue (ttm), operated at Operating Margin (ttm) of 35.73% and earned a Return on Equity (ttm) of 12.74% . The bank announced it will increase its dividend from last year's comparable payment on the 29th of September to $4.00. This takes the annual payment to 2.2% of the current stock price, which is about average for the industry. The bank's distributions have been remarkably stable over its long history of paying dividends. The dividend has gone from an annual total of $2.40 in 2015 to the most recent total annual payment of $16.00. This means that it has been growing its distributions at 21% per annum over that time. There has been strong dividend growth and there haven't been any cuts for a long time. With earnings growing rapidly and a low payout ratio the company is a great dividend stock. One has just to take into account that the dividend payment sustainability is not 100 guaranteed since while Goldman Sachs has a low payout ratio the bank’s free cash flows weren't positive based on the last payment. The increase in Goldman Sachs’ dividend is bullish for Goldman Sachs stock price.
Explore our
Trading Conditions
- Spreads from 0.0 pip
- 30,000+ Trading Instruments
- Instant Execution
Ready to Trade?
Open Account Note:
해당 개요는 유익하고 튜토리얼적인 성격을 가지고 있으며 무료로 게시됩니다. 이 개요에 포함된 모든 데이터는 어느 정도 신뢰할 수 있는 것으로 간주되는 오픈 소스에서 받은 것입니다. 또한 표시된 정보가 완전하고 정확하다는 보장이 없습니다. 개요가 업데이트되지 않습니다. 의견, 인디케이터, 차트 및 기타 항목을 포함하여 각 개요의 전체 정보는 이해의 목적으로만 제공되며 재정적 조언이나 권장 사항이 아닙니다. 전체 텍스트와 그 일부, 차트는 자산과의 거래 제안으로 간주될 수 없습니다. IFC Markets와 그 직원은 어떤 상황에서도 개요를 읽는 동안 또는 읽은 후에 다른 사람이 취한 행동에 대해 책임을 지지 않습니다.

