- 분석
- 기술적 분석
오렌지 주스 기술적 분석 - 오렌지 주스 거래: 2019-09-02
Hurricane Dorian could damage Florida oranges harvest
U.S. The Department of Agriculture (USDA) reported a reduction in citrus trees in Florida. Will the Orange quotations grow?
The total area of citrus trees this year decreased by 4% compared with the previous year and amounted to 430.6 thousand acres. This is a minimum since 1966. The main reason for the reduction in area was the hurricane Irma, which raged in 2017 and damaged many trees, as well as the disease of citrus crops, known as citrus-greening disease. Note that the USDA expects an increase in orange juice production in 2019 by about a third in all of the United States due to increased yield. Florida's share in the American citrus crop is 44%. At the same time, the main risk for an optimistic forecast may be the new hurricane Dorian, which is forming in Florida this year. An additional positive factor for quotes may be the message of the Brazilian Association of Citrus Exporters about the current reduction in stocks of frozen orange juice concentrate in Brazil by 26.2% compared to the same period in the 2017/18 season.
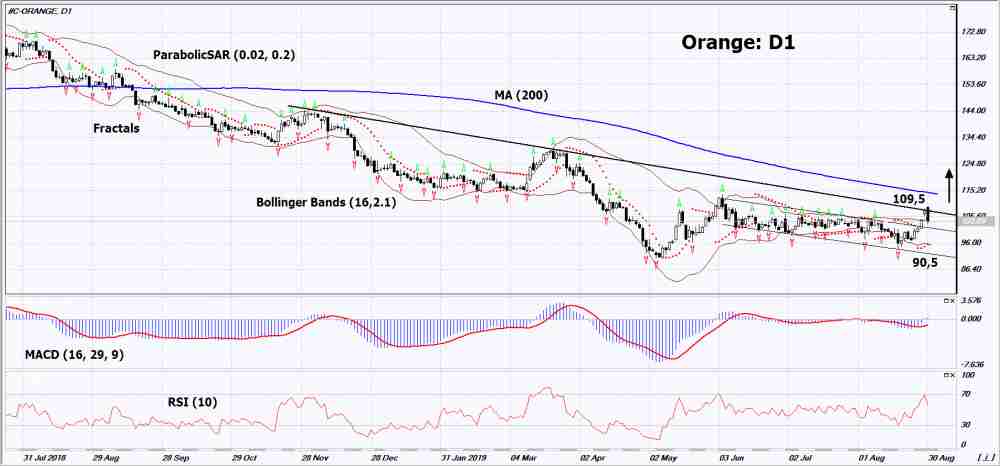
On the daily timeframe Orange: D1 corrected upward from a 10-year low and approached the downtrend resistance line. Before opening a buy position, it must be broken up.Various technical analysis indicators have generated signals to increase. Further growth of quotations is possible in the event of a decrease in yield in the United States.
- The Parabolic indicator demonstrates a signal to increase.
- The Bolinger bands widened, indicating high volatility.
- The RSI indicator is above the mark of 50. No divergence is observed.
- The MACD indicator gives a bullish signal.
The bullish momentum may develop if Orange exceeds the last maximum and the upper Bollinger line: 109.5. This level can be used as an entry point. Initial stop lose may be placed below the 10-year low, the lower Bollinger band and the Parabolic signal: 90.5. After opening the pending order, the stop shall be moved following the Bollinger and Parabolic signals to the next fractal minimum. Thus, we are changing the potential profit/loss to the breakeven point. More risk-averse traders may switch to the 4-hour chart after the trade and place a stop loss moving it in the direction of the trade. If the price meets the stop level (90,5) without reaching the order (109,5), we recommend to cancel the order: the market sustains internal changes that were not taken into account.
Technical Analysis Summary
| Position | Buy |
| Buy stop | Above 109,5 |
| Stop loss | Below 90,5 |
- 인증서 받기

Note:
해당 개요는 유익하고 튜토리얼적인 성격을 가지고 있으며 무료로 게시됩니다. 이 개요에 포함된 모든 데이터는 어느 정도 신뢰할 수 있는 것으로 간주되는 오픈 소스에서 받은 것입니다. 또한 표시된 정보가 완전하고 정확하다는 보장이 없습니다. 개요가 업데이트되지 않습니다. 의견, 인디케이터, 차트 및 기타 항목을 포함하여 각 개요의 전체 정보는 이해의 목적으로만 제공되며 재정적 조언이나 권장 사항이 아닙니다. 전체 텍스트와 그 일부, 차트는 자산과의 거래 제안으로 간주될 수 없습니다. IFC Markets와 그 직원은 어떤 상황에서도 개요를 읽는 동안 또는 읽은 후에 다른 사람이 취한 행동에 대해 책임을 지지 않습니다.
