- Analytics
- Technical Analysis
Orange Juice Technical Analysis - Orange Juice Trading: 2019-09-02
Hurricane Dorian could damage Florida oranges harvest
U.S. The Department of Agriculture (USDA) reported a reduction in citrus trees in Florida. Will the Orange quotations grow?
The total area of citrus trees this year decreased by 4% compared with the previous year and amounted to 430.6 thousand acres. This is a minimum since 1966. The main reason for the reduction in area was the hurricane Irma, which raged in 2017 and damaged many trees, as well as the disease of citrus crops, known as citrus-greening disease. Note that the USDA expects an increase in orange juice production in 2019 by about a third in all of the United States due to increased yield. Florida's share in the American citrus crop is 44%. At the same time, the main risk for an optimistic forecast may be the new hurricane Dorian, which is forming in Florida this year. An additional positive factor for quotes may be the message of the Brazilian Association of Citrus Exporters about the current reduction in stocks of frozen orange juice concentrate in Brazil by 26.2% compared to the same period in the 2017/18 season.
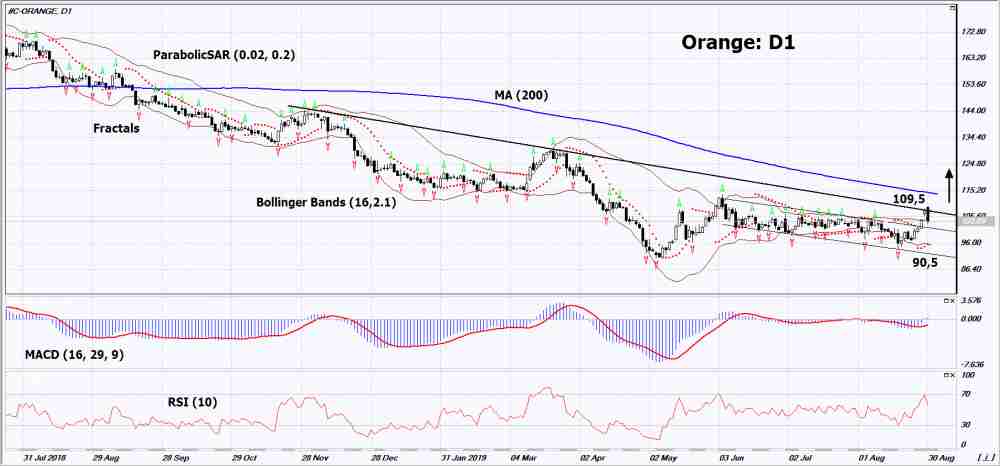
On the daily timeframe Orange: D1 corrected upward from a 10-year low and approached the downtrend resistance line. Before opening a buy position, it must be broken up.Various technical analysis indicators have generated signals to increase. Further growth of quotations is possible in the event of a decrease in yield in the United States.
- The Parabolic indicator demonstrates a signal to increase.
- The Bolinger bands widened, indicating high volatility.
- The RSI indicator is above the mark of 50. No divergence is observed.
- The MACD indicator gives a bullish signal.
The bullish momentum may develop if Orange exceeds the last maximum and the upper Bollinger line: 109.5. This level can be used as an entry point. Initial stop lose may be placed below the 10-year low, the lower Bollinger band and the Parabolic signal: 90.5. After opening the pending order, the stop shall be moved following the Bollinger and Parabolic signals to the next fractal minimum. Thus, we are changing the potential profit/loss to the breakeven point. More risk-averse traders may switch to the 4-hour chart after the trade and place a stop loss moving it in the direction of the trade. If the price meets the stop level (90,5) without reaching the order (109,5), we recommend to cancel the order: the market sustains internal changes that were not taken into account.
Technical Analysis Summary
| Position | Buy |
| Buy stop | Above 109,5 |
| Stop loss | Below 90,5 |
Explore our
Trading Conditions
- Spreads from 0.0 pip
- 30,000+ Trading Instruments
- Stop Out Level - Only 10%
Ready to Trade?
Open Account Note:
This overview has an informative and tutorial character and is published for free. All the data, included in the overview, are received from public sources, recognized as more or less reliable. Moreover, there is no guarantee that the indicated information is full and precise. Overviews are not updated. The whole information in each overview, including opinion, indicators, charts and anything else, is provided only for familiarization purposes and is not financial advice or а recommendation. The whole text and its any part, as well as the charts cannot be considered as an offer to make a deal with any asset. IFC Markets and its employees under any circumstances are not liable for any action taken by someone else during or after reading the overview.
