- Analítica
- Notícias de trading
- Exponential Moving Average (EMA): What It Is, How to Use It, Tips, and Secrets
Exponential Moving Average (EMA): What It Is, How to Use It, Tips, and Secrets

What is the Exponential Moving Average (EMA)?
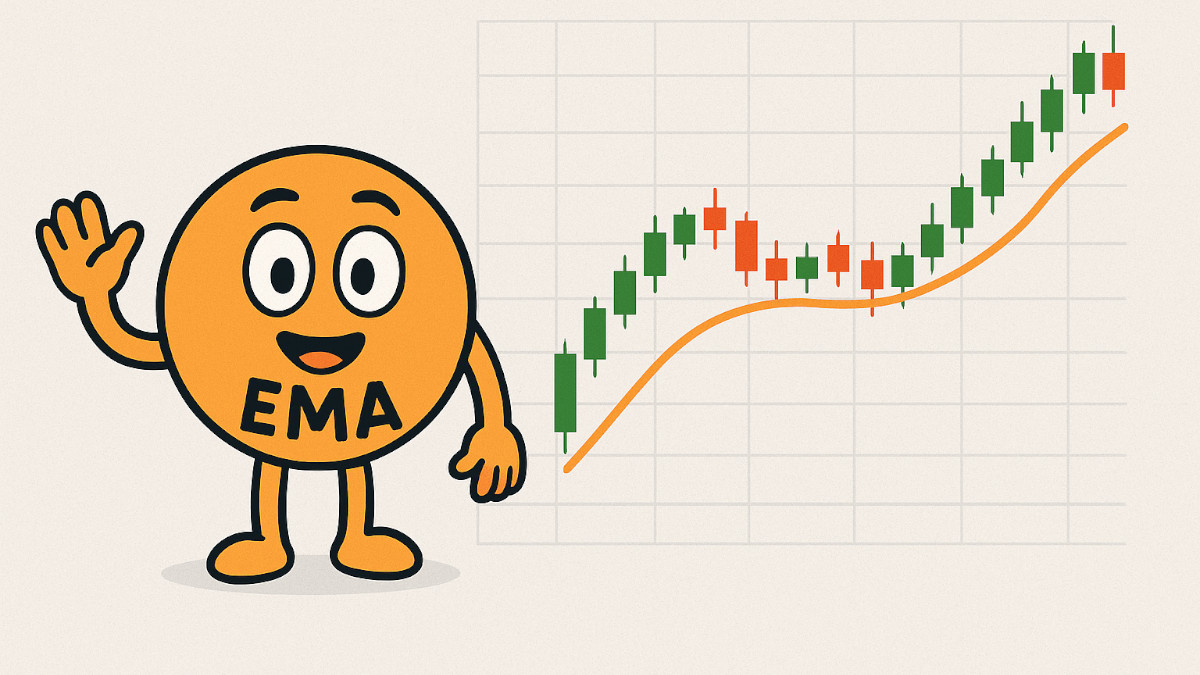
The Exponential Moving Average (EMA) is a technical indicator that tracks price trends by smoothing out past price data. Unlike the Simple Moving Average (SMA), which gives equal weight to all data points, EMA puts more weight on the most recent prices. This makes it faster to react to price changes and trend reversals.
That’s why many short-term and swing traders prefer EMA over SMA — it’s just quicker to catch what's happening now.
How is EMA Calculated?
The EMA is calculated using this formula:
EMA = (Close × Multiplier) + (EMA of Previous Day × (1 − Multiplier))
Where:
- Multiplier = 2 / (N + 1)
N = number of periods
For example, a 10-day EMA will give more weight to the most recent day than the first day in that 10-day period.
The EMA calculation requires an existing EMA from a previous period, so the first value is often a simple average used to seed the calculation.
How is EMA Used in Trading?
1. Identifying Trends
- Uptrend: Price above the EMA, and EMA is sloping upward.
- Downtrend: Price below the EMA, and EMA is sloping downward.
2. Crossover Signals
Traders often use two EMAs of different lengths
- Bullish Signal: When the short-term EMA (e.g., 12-day) crosses above the long-term EMA (e.g., 26-day).
- Bearish Signal: When the short-term EMA crosses below the long-term EMA.
This crossover technique forms the core of the MACD (Moving Average Convergence Divergence) indicator.
3. Dynamic Support and Resistance
EMA lines often act as dynamic support or resistance:
- In an uptrend, prices may pull back and bounce off the EMA (especially 21- or 50-EMA).
- In a downtrend, prices may rise to retest the EMA and then continue downward.
Popular EMA Settings
| Timeframe | Common EMA Values | Purpose |
|---|---|---|
| Short-term | 9, 12, 21 | Intraday or swing signals |
| Medium-term | 50 | Swing/position trading, trend confirmation |
| Long-term | 100, 200 | Macro trend direction |
Example:
- A 50-day EMA trending up with price above it - Bullish.
- A 200-day EMA turning flat or down with price below it - bear territory.
Tips and Secrets for Using EMA Effectively
1. Combine with Price Action
Don’t use EMA blindly. Combine it with:
- Candlestick patterns (e.g., pin bars, engulfing bars)
- Chart structure (support/resistance zones)
Secret:An EMA bounce at a known support level is more reliable than one floating in the middle of nowhere.
2. Use the Slope, Not Just Crossovers
A flat EMA means consolidation. A steep EMA slope often means strong trend momentum. Trade with the slope.
3. EMAs on Different Timeframes
A 50-EMA on the daily chart may act as major support — even for traders on the 15-minute chart. Check multiple timeframes for confluence.
4. Adjust EMA to Market Conditions
Volatile markets - Use a shorter EMA (e.g., 9).
Slower markets - Try longer EMAs (e.g., 50 or 200).
Secret:On trending days, the 9-EMA on the 5-minute chart often becomes a magnet — price keeps bouncing off it until the trend ends.
5. Don’t Ignore the Lag
Even though EMA reacts faster than SMA, it still lags. By the time you get a signal, the move may already be halfway done. That's why anticipating with price action and volume is key.
Example
Let’s say you're looking at EUR/USD on a 1-hour chart:
- You plot the 21-EMA.
- Price pulls back from a rally and touches the 21-EMA.
- At the same level, you see a bullish engulfing candle.
This bounce, combined with a bullish pattern, gives a higher-probability long trade setup. You might place your stop below the candle and target previous highs.
Limitations of EMA
- Lag: Like all moving averages, EMA lags behind price. It's not predictive.
- False Signals: In choppy or sideways markets, EMAs can give poor signals.
- News Risk: EMA doesn't factor in real-time news — only past prices.
Bottom Line on Exponential Moving Average
The Exponential Moving Average is a go-to tool for traders who want faster, more responsive insights into price action. It helps detect trends, confirm entries, and spot reversals — if used correctly. But it’s not magic. Combine EMA with price context, volume, and market awareness.
Best use case: Trending markets, with EMA acting as both signal and guide.


