- Analytics
- Technical Analysis
CORN Technical Analysis - CORN Trading: 2016-11-25
Biofuel volume is to rise in US
US Environmental Protection Agency (EPA) raised volume of biofuel to use in general gasoline production in the country in 2017. US uses up 40% corn crops to produce ethanol. Will EPA decision push corn prices up?
The Renewable Fuel Standard programme has been functioning in US since 2005 under which biofuel shall be used in gasoline and diesel production. EPA raised the volume of biofuel needed to 19.28bn gallons in 2017. This is 2.5% above the initial volume suggested in May and 6% above the required level in 2016. At this time US produce around 1mln barrels of hydrocarbons from renewable resources with corn being the main of them. Theoretically, higher EPA requirements may neutralize negative effects of expected higher crops in this season. Grains Council raised its global corn production forecast in season 2016/17 to the historical high of 1.042bn tonnes. Global crops are expected to rise 5.7% compared to season 2015/16.
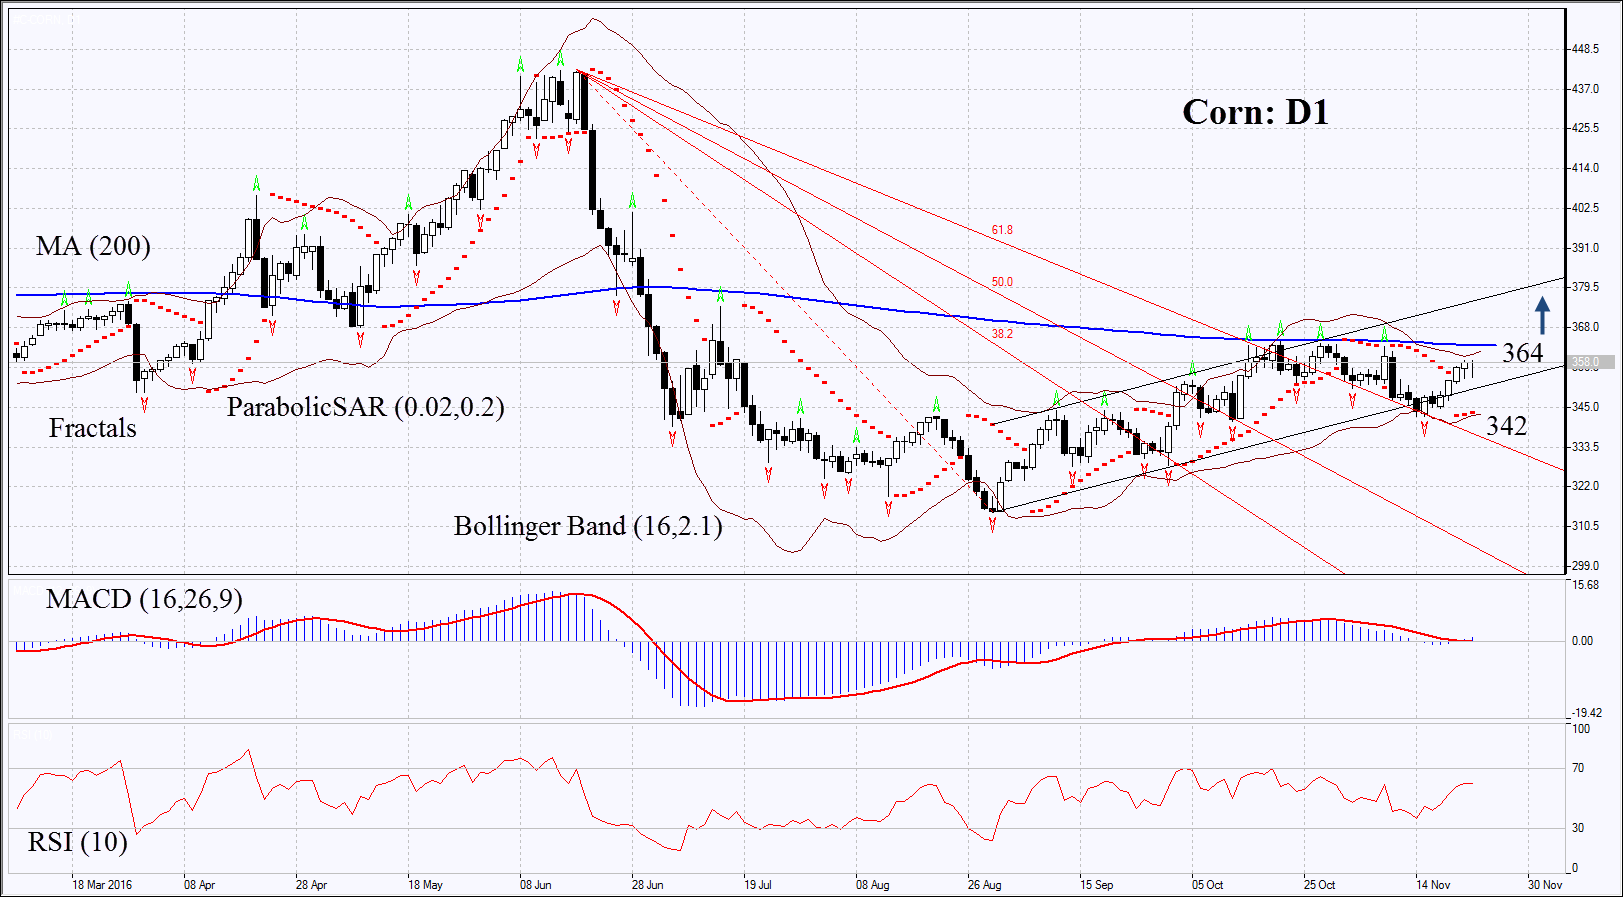
On the daily chart Corn: D1 returned to the rising channel. Further price increase is possible in case of worse weather conditions and higher demand in US and other countries.
- Parabolic gives bullish signal.
- Bollinger bands have narrowed a lot which means extremely low volatility. They are tilted upwards.
- RSI is above the level of 50 but is far from the overbought zone, no divergence.
- MACD gives bullish signal. Its low amplitude may mean low volatility.
The bullish momentum may develop in case corn prices surpass the upper Bollinger band, 200-day moving average and last fractal high at 364. This level may serve the point of entry. The initial stop-loss may be placed below the lower Bollinger band, the Parabolic signal and the last fractal low at 342. Having opened the pending order we shall move the stop to the next fractal low following the Parabolic and Bollinger signals. Thus, we are changing the probable profit/loss ratio to the breakeven point. The most risk-averse traders may switch to the 4-hour chart after the trade and place there a stop-loss moving it in the direction of the trade. If the price meets the stop-loss level at 342 without reaching the order at 364, we recommend cancelling the position: the market sustains internal changes which were not taken into account.
Summary of technical analysis
| Position | Buy |
| Buy stop | above 364 |
| Stop loss | below 342 |
- Get Certificate

Note:
This overview has an informative and tutorial character and is published for free. All the data, included in the overview, are received from public sources, recognized as more or less reliable. Moreover, there is no guarantee that the indicated information is full and precise. Overviews are not updated. The whole information in each overview, including opinion, indicators, charts and anything else, is provided only for familiarization purposes and is not financial advice or а recommendation. The whole text and its any part, as well as the charts cannot be considered as an offer to make a deal with any asset. IFC Markets and its employees under any circumstances are not liable for any action taken by someone else during or after reading the overview.
