- Analytics
- Technical Analysis
Nasdaq 100 Technical Analysis - Nasdaq 100 Trading: 2015-08-21
Leaving the 6-month neutral trend?
Let’s have a look at the daily chart of CFD for the American stock index of hi-tech companies Nasdaq 100. In the trading terminal NetTradeX it is indicated as Nd 100. The US stocks are declining for the 4th day in a row. After the release of the China’s weak index of manufacturing activity investors are worried that the slowdown in the Chinese economy may provoke the global economic crisis. What is more, Nasdaq has reacted negatively on the report on the constricted quarterly sales of smartphones Apple in China for the first time in the second quarter. We emphasize that Nasdaq 100 is still 1% higher than it was in the beginning of the year.
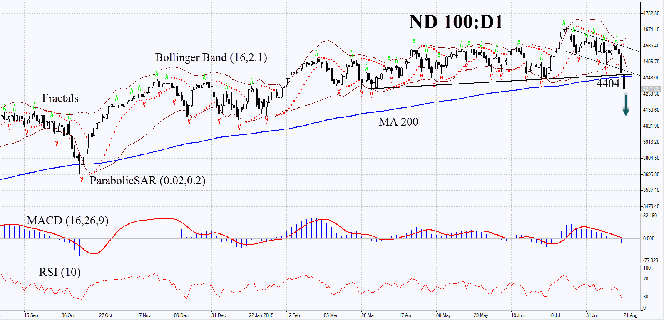
On the daily timeframe the chart of Nasdaq 100:D1 opened with a gap down on Friday overcoming its 200 MA line and leaving its 6-month neutral trend. The Parabolic Indicator has shown a sell signal. The MACD bar chart demonstrating a weak sell signal since the end of July has gone down the zero line. The Bollinger Indicator bands have widened which may indicate the higher volatility. In our opinion, all the factors mentioned above may indicate the strengthening downtrend. With all this going on, the RSI has reached the overbought level. Given the higher volatility this raises the opportunity of the countertrend chart movement or of a rebound. We assume the possibility of the further strengthening of the downtrend impulse. Theoretically, the sell position may be opened right away but the more cautious traders may do this while a possible rebound or countertrend retracement. If not now, there is a risk of missing the move. The preliminary risk fixing is possible in case of the closing gap or Nd 100 getting back to the neutral trend together with overcoming once again the 200 MA level of 4404. Having opened the position, we move the stop order level every 4 hours following the Bollinger and Parabolic Indicators onto the next fractal maximum. By doing this we are changing the potential profit/loss ratio in our favour. The most risk averse traders may switch to the 4-hour chart after the trade and to place there the stop-loss order moving it accordingly the market movements. If the price manages to overcome the stop level without touching the order we recommend to close the position as the market is subject to the internal unaccounted changes.
| Position | Sell |
| Sell | Market order |
| Stop loss | Above 4404 |
- Get Certificate

Note:
This overview has an informative and tutorial character and is published for free. All the data, included in the overview, are received from public sources, recognized as more or less reliable. Moreover, there is no guarantee that the indicated information is full and precise. Overviews are not updated. The whole information in each overview, including opinion, indicators, charts and anything else, is provided only for familiarization purposes and is not financial advice or а recommendation. The whole text and its any part, as well as the charts cannot be considered as an offer to make a deal with any asset. IFC Markets and its employees under any circumstances are not liable for any action taken by someone else during or after reading the overview.
