- Analytics
- Technical Analysis
NZD USD Technical Analysis - NZD USD Trading: 2016-12-06
New Zealand dollar weakly reacted on resignation of prime minister
New Zealand dollar slightly advanced on the surprising news the prime minister John Key resigns to spend more time with his family. Will New Zealand’s currency (kiwi) continue advancing?
Parliamentary elections in New Zealand may be held late in 2017. John Key supported the choice of his deputy Bill English for position of prime minister. His candidacy may be affirmed on December 12, 2016. The calm reaction of investors signifies low political risks in New Zealand. New Zealand dollar is being supported by relatively high, compared to other countries, base rate of 1.75%. It was cut 0.25% early this November. The next meeting of Reserve bank of New Zealand will take place on February 9, 2017. The bank has tightened the national mortgage credit. After that, chances for the next rate hike fell sharply. Significant economic data are to come out in New Zealand on December 13-14 this year: the sales and manufacturing PMI.
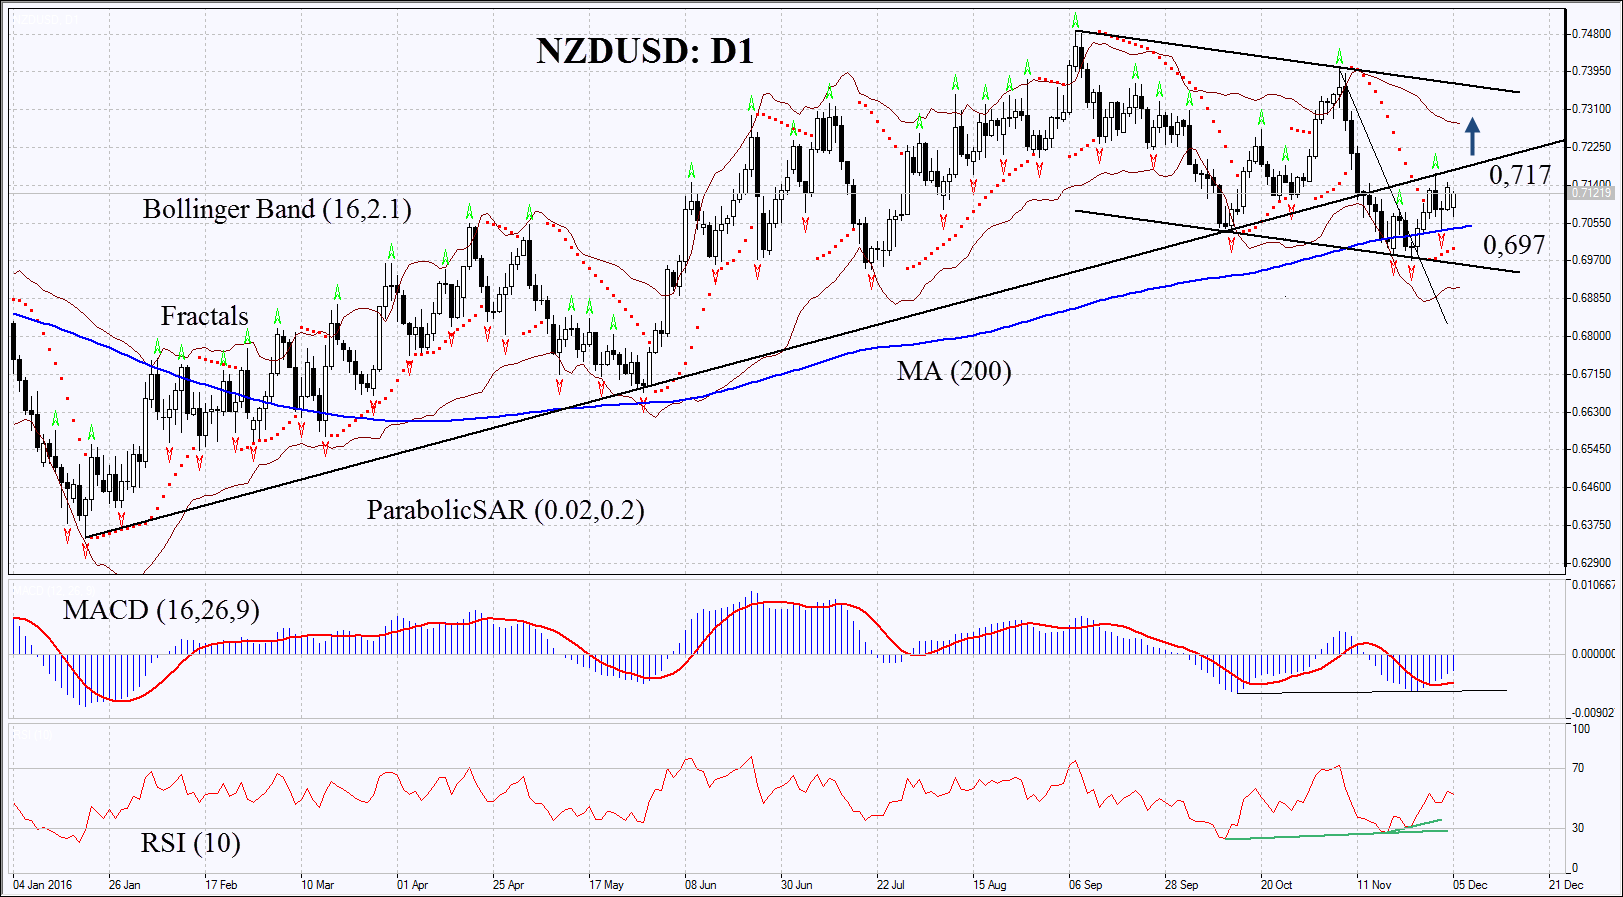
On the daily chart NZDUSD: D1 has bounced up from support of the descending channel and started correcting upwards. Its further increase is possible in case of positive economic data in New Zealand and weaker US dollar.
- Parabolic gives bullish signal.
- Bollinger bands have widened slightly which means higher volatility.
- RSI is above 50 having formed two positive divergences.
- MACD gives bullish signal.
The bullish momentum may develop in case New Zealand dollar surpasses the last fractal high and returns to the rising channel at 0.717. This level may serve the point of entry. The initial stop-loss may be placed below the two last fractal lows, the Parabolic signal and the 200-day moving average at 0.697. Having opened the pending order we shall move the stop to the next fractal low following the Parabolic and Bollinger signals. Thus, we are changing the probable profit/loss ratio to the breakeven point. The most risk-averse traders may switch to the 4-hour chart after the trade and place there a stop-loss moving it in the direction of the trade. If the price meets the stop-loss level at 0.697 without reaching the order at 0.717, we recommend cancelling the position: the market sustains internal changes which were not taken into account.
Summary of technical analysis
| Position | Buy |
| Buy stop | above 0.717 |
| Stop loss | below 0.697 |
- Get Certificate

Note:
This overview has an informative and tutorial character and is published for free. All the data, included in the overview, are received from public sources, recognized as more or less reliable. Moreover, there is no guarantee that the indicated information is full and precise. Overviews are not updated. The whole information in each overview, including opinion, indicators, charts and anything else, is provided only for familiarization purposes and is not financial advice or а recommendation. The whole text and its any part, as well as the charts cannot be considered as an offer to make a deal with any asset. IFC Markets and its employees under any circumstances are not liable for any action taken by someone else during or after reading the overview.
