- Analytics
- Technical Analysis
Technical Analysis - Trading: 2015-04-01
US healthcare expenses may be cut
In this overview we would like to present you a Personal Composite Instrument (PCI). We called it “Healthcare Stock Index” and assigned &Health_Stocks symbol to it. The instrument comprises the shares of 5 largest American healthcare companies: Johnson & Johnson, Eli Lilly, Merck, Pfizer and United Health Group. Since March, 2009 (period of the world economic crisis) the instrument has risen 3.2 times, which can be compared to S&P 500. The index has increased 2.2%, despite Q4 GDP forecast was cut. The estimates for GDP in the first quarter, 2015 are even lower. According to JPMorgan, it will add 1.5%, while Morgan Stanley expects 0.9% growth. We assume that the government may reduce healthcare expenses to cut federal spending and support economy. To be noted, the Republicans have criticized Obamacare since the day it was launched and have recently won a lawsuit on healthcare subsidies distribution.
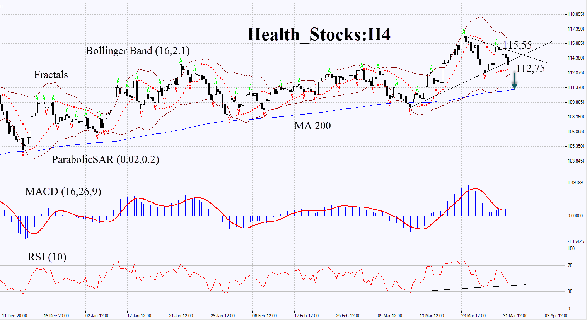
The &Health_Stocks Index breached the short-term downtrend support but hasn't yet renewed the previous fractal low. Bollinger indicator hasn't expanded and the curve is still far away from its boundaries. In our opinion, that represents the lack of volatility as confirmed by MACD indicator. Its bars are located above the zero level and below the signal level, which indicates a bearish momentum. RSI-Bars is ascending. It is situated below 50 but hasn't yet reached the overbought zone. The bearish movement may continue, if the latest &Health_Stocks bar closes below the recent fractal least value and Bollinger bottom – 112.75 at the moment. When it happens, Parabolic is supposed to pull back. Stop loss may be placed at the recent fractal high, which may now act as a support line, at 115.55. After pending order placing, stop loss is to be moved near the next fractal high, following Parabolic and Bollinger signals. Thus, we are changing the probable profit/loss ratio to the breakeven point. If the price meets stop loss level without reaching the order, we recommend canceling the position: market sustains internal changes that were considered.
| Position | Sell |
| Sell stop | below 112,75 |
| Stop loss | above 115,55 |
- Get Certificate

Note:
This overview has an informative and tutorial character and is published for free. All the data, included in the overview, are received from public sources, recognized as more or less reliable. Moreover, there is no guarantee that the indicated information is full and precise. Overviews are not updated. The whole information in each overview, including opinion, indicators, charts and anything else, is provided only for familiarization purposes and is not financial advice or а recommendation. The whole text and its any part, as well as the charts cannot be considered as an offer to make a deal with any asset. IFC Markets and its employees under any circumstances are not liable for any action taken by someone else during or after reading the overview.
