- Analytics
- Technical Analysis
USD CAD Technical Analysis - USD CAD Trading: 2015-10-08
Canadian dollar reversing bearish trend
Canadian dollar strengthened following GDP report last week indicating Canadian economy continued expanding after contracting in the first half of 2015. Labor market report on Friday is expected to indicate unemployment declined in September. Will the positive momentum carry the Canadian dollar higher against the US dollar?
As a result of monetary easing by Bank of Canada which cut interest rates twice in 2015 Canadian economy continued expanding in July with GDP growing 0.3% in seasonally adjusted terms over the previous month. This was the second month of growth so far this year, which exceeded expectations of 0.2% increase after a downward revised expansion of 0.4% in June. Retail sales, which is a significant component of consumer spending driving GDP growth, also grew for the third consecutive month in July, expanding 0.5 % over the previous month. Since the start of October oil prices have risen over 8%, providing additional support to Canadian dollar. Next significant release of economic data in Canada is scheduled for October 9 when labor market data will be published, with unemployment in September expected to decline to 6.9% from 7% in August, indicating continued strength for Canadian currency unless of course the report surprises to the negative side. On the other hand US dollar weakened after the release of disappointing jobs report on October 2 as investors pushed back timing of an expected rate hike by the Federal Reserve into 2016.
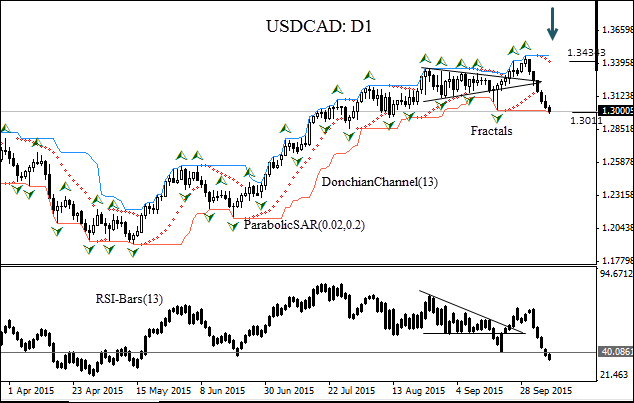
USDCAD has been falling on the daily timeframe since the release of GDP report on September 30 after it broke out of the consolidation triangle following the Federal Open Market Committee decision on September 17. The Parabolic indicator has formed a sell signal. The RSI-Bars oscillator also confirms the downtrend. We expect the bearish momentum will continue after the price closes below the lower bound of Donchian channel at 1.3011. A pending order to sell can be placed below that level, with the stop loss above the last fractal high at 1.34343. After placing the pending order, the stop loss is to be moved every day to the next fractal high, following Parabolic signals. Thus, we are changing the probable profit/loss ratio to the breakeven point. If the price meets the stop loss level without reaching the order, we recommend cancelling the position: the market sustains internal changes which were not considered.
| Position | Sell |
| Sell stop | below 1.3011 |
| Stop loss | above 1.34343 |
- Get Certificate

Note:
This overview has an informative and tutorial character and is published for free. All the data, included in the overview, are received from public sources, recognized as more or less reliable. Moreover, there is no guarantee that the indicated information is full and precise. Overviews are not updated. The whole information in each overview, including opinion, indicators, charts and anything else, is provided only for familiarization purposes and is not financial advice or а recommendation. The whole text and its any part, as well as the charts cannot be considered as an offer to make a deal with any asset. IFC Markets and its employees under any circumstances are not liable for any action taken by someone else during or after reading the overview.
