- マーケット分析
- 値上がり率と値下がり率
Top Gainers and Losers: Australian dollar and US dollar
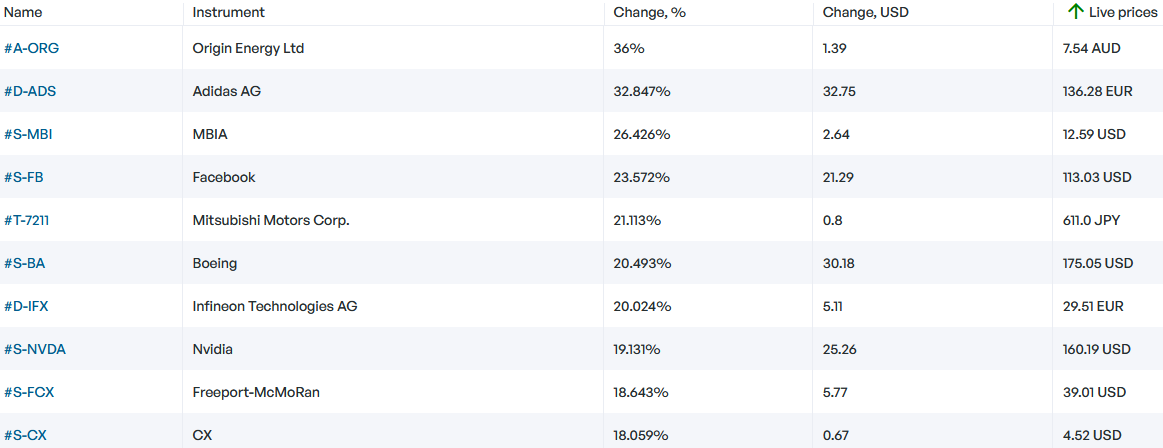
Top Gainers - global market
Over the past 7 days, the US dollar index has fallen by almost 4% due to important statistics. In October, US inflation amounted to +0.4% m/m. This is less than expected (+0.6% m/m). Now the probability of a Fed rate hike of 0.5% has exceeded 80%, while a week earlier it was only 52%. Prior to this, the American regulator raised the rate by 0.75% four times in a row and now it is 4%. It should be noted that annual inflation in the US in October for the first time in 8 months turned out to be less than 8% and amounted to 7.7%. This is the minimum since January of this year +7.5% y/y. Cryptocurrency quotes collapsed amid the possible bankruptcy of the FTX Cryptocurrency Exchange. The Australian and New Zealand dollars strengthened noticeably due to rising prices for commodities. An additional positive for them was the easing of anti-coronavirus restrictions in China. The yen was supported by an unexpectedly large Japan Current Account in September.
1.Origin Energy Ltd, +36% – Australian Energy Company
2. Adidas AG, +32.9% – German sportswear and footwear manufacturer
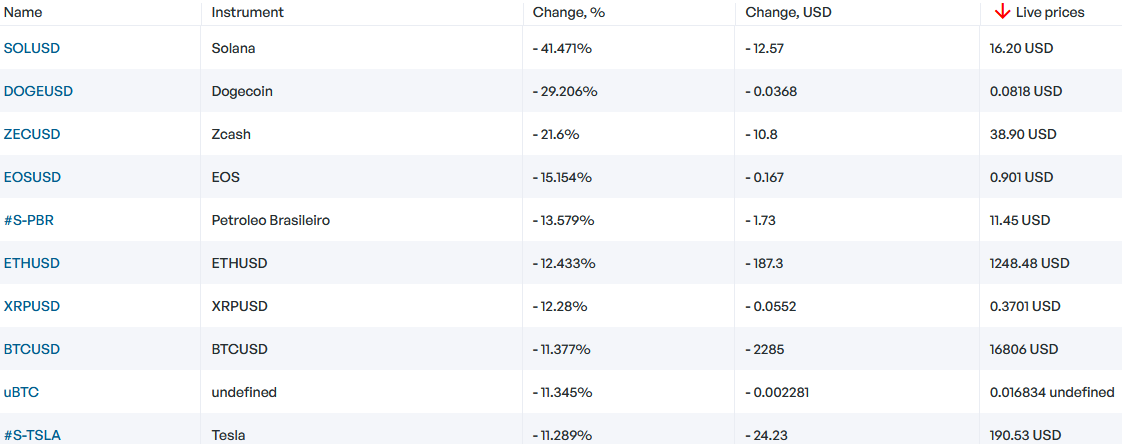
Top Losers - global market
1. SOLUSD – Solana (SOL) cryptocurrency
2. DOGEUSD – Dogecoin (DOGE) cryptocurrency.
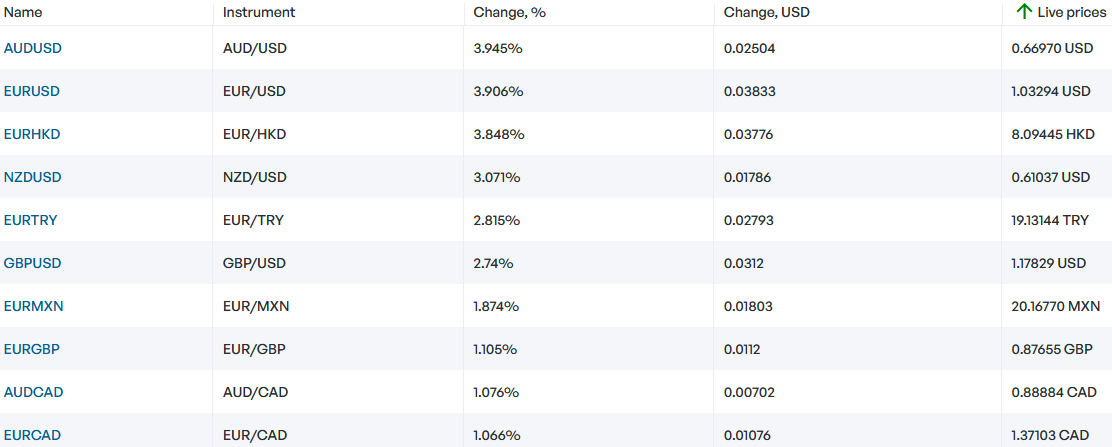
Top Gainers - foreign exchange market (Forex)
1. AUDUSD, NZDUSD - the growth of these graphs means the strengthening of the Australian and New Zealand dollars against the US dollar.
2. EURUSD, EURHKD - the growth of these graphs means the weakening of the US and Hong Kong dollars against the euro.
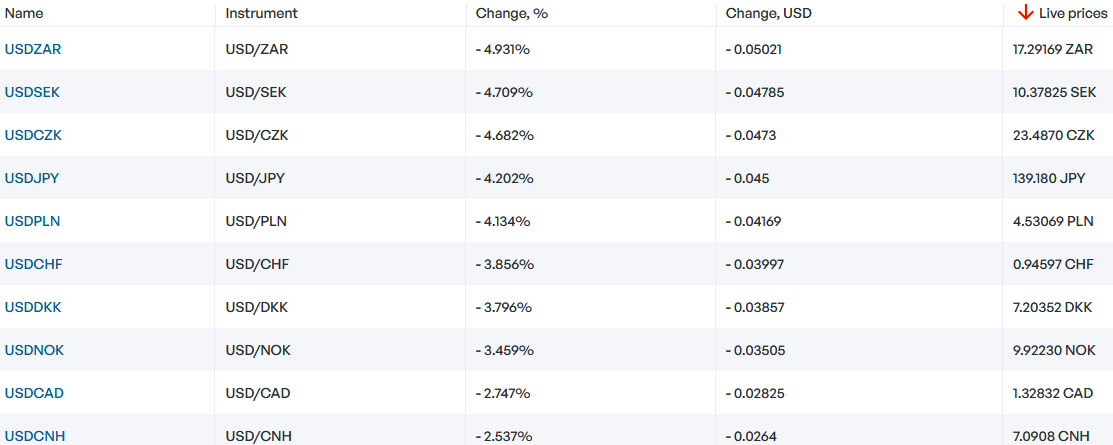
Top Losers - foreign exchange market (Forex)
1. USDZAR, USDSEK - the decline of these graphs means the weakening of the US dollar against the South African rand and Swedish krona.
2. USDCZK, USDJPY - the decline of these graphs means the strengthening of the Czech crown and the Japanese yen against the US dollar.
【重要な注意事項】:
本レポートは、当社の親会社であるアイエフシーマーケットが作成したものの邦訳です。本レポートには、当社のサービスと商品についての情報を含みますが、お客様の投資目的、財務状況、資金力にかかわらず、情報の提供のみを目的とするものであり、金融商品の勧誘、取引の推奨、売買の提案等を意図したものではありません。 本レポートは、アイエフシーマーケットが信頼できると思われる情報にもとづき作成したものですが、次の点に十分ご留意ください。アイエフシーマーケットおよび当社は、本レポートが提供する情報、分析、予測、取引戦略等の正確性、確実性、完全性、安全性等について一切の保証をしません。アイエフシーマーケットおよび当社は、本レポートを参考にした投資行動が利益を生んだり損失を回避したりすることを保証または約束あるいは言外に暗示するものではありません。アイエフシーマーケットおよび当社は、本レポートに含まれる不確実性、不正確性、不完全性、誤謬、文章上の誤り等に起因して、お客様または第三者が損害(直接的か間接的かを問いません。)を被った場合でも、一切の責任を負いません。
- コースを取って、


過去の安値・高値
Over the past 7 days, the American dollar has remained almost unchanged. According to the CME FedWatch tool, there is an 89% probability of the U.S. Federal Reserve raising interest rates at the meeting on July 26th. The Swiss franc has strengthened due to positive economic indicators such as Credit...
Over the past 7 days, the US dollar index has declined. As expected, the Federal Reserve (Fed) maintained its interest rate at 5.25% during the meeting on June 14. Now, investors are monitoring economic statistics and trying to forecast the change in the Fed's rate at the next meeting on July 26. The...
Over the past 7 days, the US dollar index has remained largely unchanged. It has been trading in a narrow range of 103.2-104.4 points for the 4th week in a row. Investors are awaiting the outcome of the Federal Reserve meeting on June 14. Tesla shares have risen due to the opening of new gigafactories...