

- Analýza
- Tržní údaje
- Kotace CFD na akcie
- Dnešní Cena Akcií CHINA LIFE
2628: Akcie CHINA LIFE graf
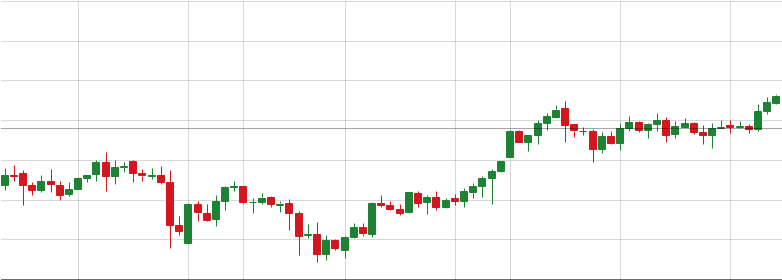
This page includes full information about the CHINA LIFE stock, including the CHINA LIFE stock chart and dynamics on the chart by choosing any of 8 available time frames.
By moving the start and end of the timeframe in the bottom panel you can see both the current and the historical price movements of the instrument. In addition, you have an opportunity to choose the type of display of the CHINA LIFE stock price – Candles or Lines chart – through the buttons in the upper left corner of the chart. All clients that have not yet decided which instrument to trade are in the right place since reading the full characteristics of the CHINA LIFE stock and watching its performance on the charts will help them to make their final decision.
Dnešní Cena Akcií CHINA LIFE
- 1m
- 5m
- 15m
- 30m
- 1h
- 4h
- 1d
- 1t
The Price of CHINA LIFE is Falling This Week
CHINA LIFE is currently trading at 23.57, down 2.4% since yesterday. Looking at broader trends, it's shifted 2.21% this week and 1.81% over the last 30 days.
| Zvolte období nebo rozsah dat | Otevírací cena | Změna % |
|---|---|---|
| Daily | 23.05 | 2.4% |
| Každotýdenní | 23.83 | 2.21% |
| Každoměsíční | 26.79571 | 1.81% |
Technická analýza
Technická analýza je metoda pro studium a odhad dynamiky trhu na základě historie kotací. Jejím hlavním cílem je odhadnout dynamiku kotací finančního instrumentu v budoucnu pomocí indikátorů technické analýzy v budoucnu. Techničtí analytici používají tuto metodu analýzy trhu, aby bylo možné předvídat ceny různých měn a měnových párů. Tento typ analýzy Vám umožní správně odhadovat trh na základě prozkoumání historických cen obchodních instrumentů.
Viz rovněž poslední technické analýzy dynamiky kotací 2628: 2628 odhad.