- マーケット分析
- テクニカル分析
AUD/USD テクニカル分析 - AUD/USD 取引:2017-06-28
Strengthening of labor market is bullish for Australian dollar
The Reserve Bank of Australia held its policy unchanged at June 4 policy meeting. The fall in unemployment to 5.5% in May from 5.7% in April was bullish development. Will the Australian dollar continue strengthening?
The Reserve Bank of Australia held the interest rate at 1.5% for the ninth month at its June 4 policy meeting. The central bank mentioned it didn’t want to hike rates since the depreciation of the exchange rate since 2013 has assisted the economy in its transition following the mining investment boom, and the outlook continues to be supported by the low level of interest rates. The unexpected fall in unemployment in May was a bullish development for the Australian dollar. It indicated continued strength of labor market as the labor force participation rose to a 10-month high of 64.9% from 64.8% in the previous period.
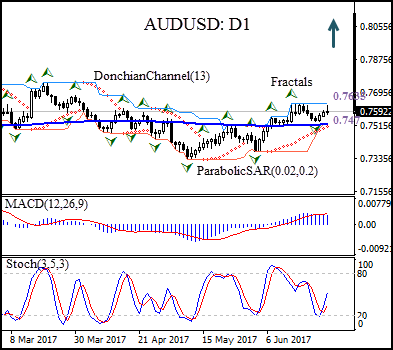
On the daily timeframe AUDUSD: D1 is rebounding after hitting five-month low in the beginning of May. The price has risen above the 200-day moving average MA(200).
- The Donchian channel indicates uptrend: it is tilted upward.
- The Parabolic indicator gives a buy signal.
- The MACD indicator is above the signal line and the gap is widening, which is a bullish signal.
- The stochastic oscillator has bounced off from the oversold zone threshold and is rising.
We believe the bullish momentum will continue after the price closes above the upper boundary of Donchian channel at 0.7635, confirmed also by fractal high. This level can be used as an entry point for placing a pending order to buy. The stop loss can be placed below the Parabolic signal at 0.747. After placing the order, the stop loss is to be moved every day to the next fractal low, following Parabolic signals. Thus, we are changing the probable profit/loss ratio to the breakeven point. If the price meets the stop loss level (0.747) without reaching the order (0.7635), we recommend cancelling the position: the market has undergone internal changes which were not taken into account.
Technical Analysis Summary
| Position | Buy |
| Buy stop | Above 0.7635 |
| Stop loss | Below 0.747 |
- コースを取って、

【重要な注意事項】:
本レポートは、当社の親会社であるアイエフシーマーケットが作成したものの邦訳です。本レポートには、当社のサービスと商品についての情報を含みますが、お客様の投資目的、財務状況、資金力にかかわらず、情報の提供のみを目的とするものであり、金融商品の勧誘、取引の推奨、売買の提案等を意図したものではありません。 本レポートは、アイエフシーマーケットが信頼できると思われる情報にもとづき作成したものですが、次の点に十分ご留意ください。アイエフシーマーケットおよび当社は、本レポートが提供する情報、分析、予測、取引戦略等の正確性、確実性、完全性、安全性等について一切の保証をしません。アイエフシーマーケットおよび当社は、本レポートを参考にした投資行動が利益を生んだり損失を回避したりすることを保証または約束あるいは言外に暗示するものではありません。アイエフシーマーケットおよび当社は、本レポートに含まれる不確実性、不正確性、不完全性、誤謬、文章上の誤り等に起因して、お客様または第三者が損害(直接的か間接的かを問いません。)を被った場合でも、一切の責任を負いません。
