- Analytics
- Technical Analysis
AUD USD Technical Analysis - AUD USD Trading: 2017-06-28
Strengthening of labor market is bullish for Australian dollar
The Reserve Bank of Australia held its policy unchanged at June 4 policy meeting. The fall in unemployment to 5.5% in May from 5.7% in April was bullish development. Will the Australian dollar continue strengthening?
The Reserve Bank of Australia held the interest rate at 1.5% for the ninth month at its June 4 policy meeting. The central bank mentioned it didn’t want to hike rates since the depreciation of the exchange rate since 2013 has assisted the economy in its transition following the mining investment boom, and the outlook continues to be supported by the low level of interest rates. The unexpected fall in unemployment in May was a bullish development for the Australian dollar. It indicated continued strength of labor market as the labor force participation rose to a 10-month high of 64.9% from 64.8% in the previous period.
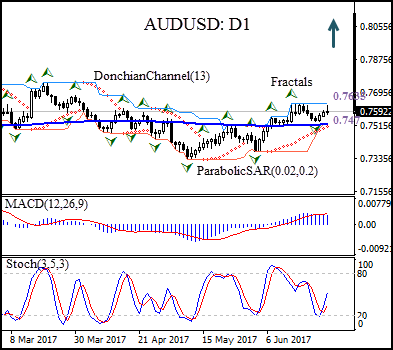
On the daily timeframe AUDUSD: D1 is rebounding after hitting five-month low in the beginning of May. The price has risen above the 200-day moving average MA(200).
- The Donchian channel indicates uptrend: it is tilted upward.
- The Parabolic indicator gives a buy signal.
- The MACD indicator is above the signal line and the gap is widening, which is a bullish signal.
- The stochastic oscillator has bounced off from the oversold zone threshold and is rising.
We believe the bullish momentum will continue after the price closes above the upper boundary of Donchian channel at 0.7635, confirmed also by fractal high. This level can be used as an entry point for placing a pending order to buy. The stop loss can be placed below the Parabolic signal at 0.747. After placing the order, the stop loss is to be moved every day to the next fractal low, following Parabolic signals. Thus, we are changing the probable profit/loss ratio to the breakeven point. If the price meets the stop loss level (0.747) without reaching the order (0.7635), we recommend cancelling the position: the market has undergone internal changes which were not taken into account.
Technical Analysis Summary
| Position | Buy |
| Buy stop | Above 0.7635 |
| Stop loss | Below 0.747 |
Explore our
Trading Conditions
- Spreads from 0.0 pip
- 30,000+ Trading Instruments
- Stop Out Level - Only 10%
Ready to Trade?
Open Account Note:
This overview has an informative and tutorial character and is published for free. All the data, included in the overview, are received from public sources, recognized as more or less reliable. Moreover, there is no guarantee that the indicated information is full and precise. Overviews are not updated. The whole information in each overview, including opinion, indicators, charts and anything else, is provided only for familiarization purposes and is not financial advice or а recommendation. The whole text and its any part, as well as the charts cannot be considered as an offer to make a deal with any asset. IFC Markets and its employees under any circumstances are not liable for any action taken by someone else during or after reading the overview.
