- マーケット分析
- テクニカル分析
コーン テクニカル分析 - コーン 取引:2019-10-10
High demand bullish for corn price
US export sales were stronger than forecast while quality ratings declined last week. Will the corn price continue rising?
On the demand side US corn export inspections improved slightly last week compared to the one previous the last, rising to 18.4 million bushels from 16.6 million bushels up due to heavy buying from Mexico. On the other hand USDA crop progress report Monday reinforced supply concerns: quality ratings fell another point to 56% in good-to-excellent condition. And harvest is moving slower than expected, with 15% completed as of October 6. Higher demand and lower expected crop is bullish for corn prices. Today’s US Department of Agriculture monthly World Agricultural Supply and Demand Estimates report may be a downside risk in case of higher crop supply estimates
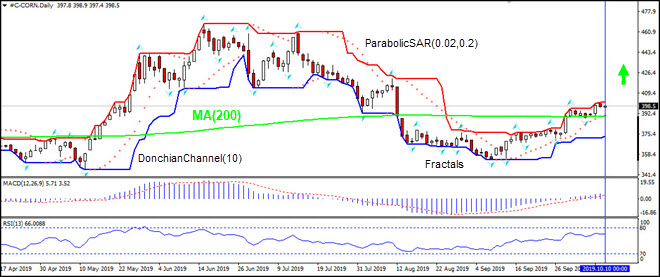
On the daily timeframe the CORN: D1 has been rising after closing above the 200-day moving average MA(200).
- The Parabolic indicator has formed a buy signal.
- The Donchian channel indicates uptrend: it is narrowing up.
- The MACD indicator gives a bullish signal: it is above the signal line and the gap is widening.
- The RSI oscillator is above 50 level and has not reached the overbought zone.
We expect the bullish momentum will resume after the price breaches above the upper Donchian bound at 401.5. A price above that level can be used as an entry point for a pending order to buy. The stop loss can be placed below the fractal low at 388.3. After placing the pending order, the stop loss is to be moved to the next fractal low, following Parabolic signals. By doing so, we are changing the expected profit/loss ratio to the breakeven point. If the price meets the stop loss level (388.3) without reaching the order, we recommend canceling the order: the market sustains internal changes which were not taken into account.
Technical Analysis Summary
| Order | Buy |
| Buy stop | Above 401.5 |
| Stop loss | Below 388.3 |
- コースを取って、

【重要な注意事項】:
本レポートは、当社の親会社であるアイエフシーマーケットが作成したものの邦訳です。本レポートには、当社のサービスと商品についての情報を含みますが、お客様の投資目的、財務状況、資金力にかかわらず、情報の提供のみを目的とするものであり、金融商品の勧誘、取引の推奨、売買の提案等を意図したものではありません。 本レポートは、アイエフシーマーケットが信頼できると思われる情報にもとづき作成したものですが、次の点に十分ご留意ください。アイエフシーマーケットおよび当社は、本レポートが提供する情報、分析、予測、取引戦略等の正確性、確実性、完全性、安全性等について一切の保証をしません。アイエフシーマーケットおよび当社は、本レポートを参考にした投資行動が利益を生んだり損失を回避したりすることを保証または約束あるいは言外に暗示するものではありません。アイエフシーマーケットおよび当社は、本レポートに含まれる不確実性、不正確性、不完全性、誤謬、文章上の誤り等に起因して、お客様または第三者が損害(直接的か間接的かを問いません。)を被った場合でも、一切の責任を負いません。
