- マーケット分析
- テクニカル分析
フェデックス テクニカル分析 - フェデックス 取引:2019-06-17
Will FedEx’s discontinuation of air delivery for Amazon drag on its stock?
FedEx decided not to continue the contract on air express delivery for Amazon packages. Will the FedEx stock price continue rebounding?
FedEx’s third quarter financial results were below expectations due to slowing global economies: the company reported earnings per share of $3.03, short of analyst estimates of $3.10. Net income fell to $797 million from $1.02 billion compared to the same quarter last year, with revenue rising from $16.5 billion to $17 billion. FedEx announced June 7 it will no longer provide air express delivery for Amazon packages in the US while continuing to serve as a carrier and last-mile delivery partner. Amazon accounted for only 1.3% of FedEx’s total revenue in 2018. FedEx stock dropped less than 1% on the news. FedEx’s next earnings report is scheduled for June 25. The company is expected to report earnings of $4.89 per share, a 17.26% year-over-year decline. However Zachs investment research company estimates FedEx will record a 3.75% increase in revenue from the year-ago period to $17.96 billion. FedEx’s stocks is currently trading at a forward price-to-earnings (P/E) ratio of 9.64. For comparison, its industry has an average forward P/E of 12.92, meaning FedEx’s stock is trading at a discount to the industry. While continuing global growth slowing is a downside risk for FedEx stock, the company is making investments to create new services and streamline in-house network of shipping and delivery services which should boost its competitiveness.
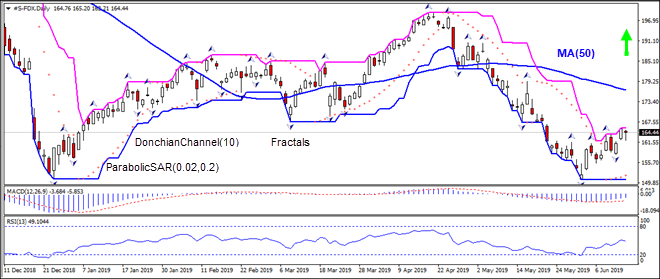
On the daily timeframe the S-FDX: D1 is retracing higher after falling to six-month low in the end of May.
- The Parabolic indicator gives a buy signal.
- The Donchian channel indicates uptrend: it has widened up.
- The MACD indicator gives a bullish signal: it is below the signal line and the gap is narrowing.
- The RSI oscillator is declining but has not reached the oversold zone yet.
We believe the bullish momentum will continue after the price breaches above the upper boundary of Donchian channel at 165.79. This level can be used as an entry point for placing a pending order to buy. The stop loss can be placed below the fractal low at 158.07. After placing the order, the stop loss is to be moved every day to the next fractal low, following Parabolic signals. Thus, we are changing the expected profit/loss ratio to the breakeven point. If the price meets the stop loss level (158.07) without reaching the order (165.79), we recommend cancelling the order: the market has undergone internal changes which were not taken into account.
Technical Analysis Summary
| Position | Buy |
| Buy stop | Above 165.79 |
| Stop loss | Below 158.07 |
- コースを取って、

【重要な注意事項】:
本レポートは、当社の親会社であるアイエフシーマーケットが作成したものの邦訳です。本レポートには、当社のサービスと商品についての情報を含みますが、お客様の投資目的、財務状況、資金力にかかわらず、情報の提供のみを目的とするものであり、金融商品の勧誘、取引の推奨、売買の提案等を意図したものではありません。 本レポートは、アイエフシーマーケットが信頼できると思われる情報にもとづき作成したものですが、次の点に十分ご留意ください。アイエフシーマーケットおよび当社は、本レポートが提供する情報、分析、予測、取引戦略等の正確性、確実性、完全性、安全性等について一切の保証をしません。アイエフシーマーケットおよび当社は、本レポートを参考にした投資行動が利益を生んだり損失を回避したりすることを保証または約束あるいは言外に暗示するものではありません。アイエフシーマーケットおよび当社は、本レポートに含まれる不確実性、不正確性、不完全性、誤謬、文章上の誤り等に起因して、お客様または第三者が損害(直接的か間接的かを問いません。)を被った場合でも、一切の責任を負いません。
