- マーケット分析
- テクニカル分析
フランス40指数 テクニカル分析 - フランス40指数 取引:2019-11-07
Rising composite PMI bullish for FR40
Composite PMI in France rose in October. Will the FR40 stock index continue rising?
French economic data were positive on balance after slowing inflation report a week ago: French economy advanced 0.3 percent on quarter in the three months to September 2019, the same pace as in the previous two quarters but above forecast of a 0.2 percent growth, and while retail sales growth slowed in September private sector expansion accelerated in October. Retail sales grew 4.1% over year in September after 4.2% growth in August, while both manufacturing and services sectors PMI’s rose contributing to increase in composite PMI to 52.6 from 50.8 in September. Readings above 50 indicate expansion. Accelerating private sector activity is bullish for French equities index.
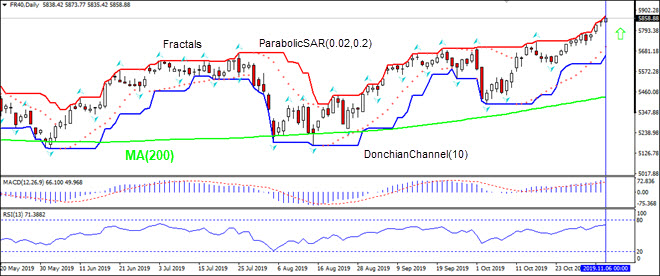
On the daily timeframe FR40: D1 is rising above the 200-day moving average MA(200) which is still rising.
- The Donchian channel indicates uptrend: it is tilted up.
- The Parabolic indicator has formed a buy signal.
- The MACD indicator is above the signal line and the gap is widening, this is bullish.
- The RSI oscillator is above 50 mark but has not reached the overbought zone.
We believe the bullish momentum will continue as the price breaches above the upper boundary of Donchian channel at 5847.51. This level can be used as an entry point for placing a pending order to buy. The stop loss can be placed below the fractal low at 5610.36. After placing the order, the stop loss is to be moved every day to the next fractal low, following Parabolic signals. Thus, we are changing the expected profit/loss ratio to the breakeven point. If the price meets the stop loss level (5847.51) without reaching the order (5610.36), we recommend cancelling the order: the market has undergone internal changes which were not taken into account.
Technical Analysis Summary
| Order | Buy |
| Buy stop | Above 5847.51 |
| Stop loss | Below 5610.36 |
- コースを取って、

【重要な注意事項】:
本レポートは、当社の親会社であるアイエフシーマーケットが作成したものの邦訳です。本レポートには、当社のサービスと商品についての情報を含みますが、お客様の投資目的、財務状況、資金力にかかわらず、情報の提供のみを目的とするものであり、金融商品の勧誘、取引の推奨、売買の提案等を意図したものではありません。 本レポートは、アイエフシーマーケットが信頼できると思われる情報にもとづき作成したものですが、次の点に十分ご留意ください。アイエフシーマーケットおよび当社は、本レポートが提供する情報、分析、予測、取引戦略等の正確性、確実性、完全性、安全性等について一切の保証をしません。アイエフシーマーケットおよび当社は、本レポートを参考にした投資行動が利益を生んだり損失を回避したりすることを保証または約束あるいは言外に暗示するものではありません。アイエフシーマーケットおよび当社は、本レポートに含まれる不確実性、不正確性、不完全性、誤謬、文章上の誤り等に起因して、お客様または第三者が損害(直接的か間接的かを問いません。)を被った場合でも、一切の責任を負いません。
