- マーケット分析
- テクニカル分析
Nvidia Corp. テクニカル分析 - Nvidia Corp. 取引:2019-05-16
Lower sales expectations bearish for Nvidia price
Nvidia corporation is forecast to report first quarter revenue drop of over 30%. Will the Nvidia price continue declining?
Nvidia Corporation is expected to report first quarter revenue drop - more than 31% year over year to $2.2 billion. Among the reasons for the expected drop are weak graphics processing unit (GPU) demand and loss of Tesla business. NVIDIA's gaming business is its biggest source of revenue, accounting for about 43% of total sales. As a result, the company's earnings are expected to drop to $0.79 per share in the first quarter, down from $2.05 per share a year ago. Lower revenue forecast is bearish for Nvidia stock price. On the other hand, a surprise in the form of not such a sharp decline in revenue is an upside risk which might boost the stock price.
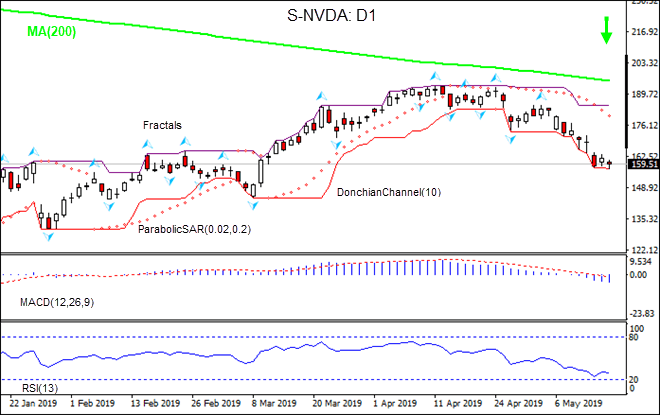
On the daily timeframe the S-NVDA: D1 is below the 200-day moving average MA(200) which is falling. This is bearish.
- The Parabolic indicator gives a sell signal.
- The Donchian channel indicates downtrend: it is tilted lower.
- The MACD indicator gives a bearish signal: it is below the signal line and the gap is widening.
- The RSI oscillator is falling but has not breached into the oversold zone yet.
We believe the bearish momentum will continue after the price breaches below the lower boundary of Donchian channel at 157.4. This level can be used as an entry point for placing a pending order to sell. The stop loss can be placed above the fractal high at 184.8. After placing the order, the stop loss is to be moved every day to the next fractal high, following Parabolic signals. Thus, we are changing the expected profit/loss ratio to the breakeven point. If the price meets the stop loss level (184.8) without reaching the order (157.4), we recommend cancelling the order: the market has undergone internal changes which were not taken into account.
Technical Analysis Summary
| Position | Sell |
| Sell stop | Below 157.4 |
| Stop loss | Above 184.8 |
- コースを取って、

【重要な注意事項】:
本レポートは、当社の親会社であるアイエフシーマーケットが作成したものの邦訳です。本レポートには、当社のサービスと商品についての情報を含みますが、お客様の投資目的、財務状況、資金力にかかわらず、情報の提供のみを目的とするものであり、金融商品の勧誘、取引の推奨、売買の提案等を意図したものではありません。 本レポートは、アイエフシーマーケットが信頼できると思われる情報にもとづき作成したものですが、次の点に十分ご留意ください。アイエフシーマーケットおよび当社は、本レポートが提供する情報、分析、予測、取引戦略等の正確性、確実性、完全性、安全性等について一切の保証をしません。アイエフシーマーケットおよび当社は、本レポートを参考にした投資行動が利益を生んだり損失を回避したりすることを保証または約束あるいは言外に暗示するものではありません。アイエフシーマーケットおよび当社は、本レポートに含まれる不確実性、不正確性、不完全性、誤謬、文章上の誤り等に起因して、お客様または第三者が損害(直接的か間接的かを問いません。)を被った場合でも、一切の責任を負いません。
