- マーケット分析
- テクニカル分析
銀 テクニカル分析 - 銀 取引:2017-01-04
Demand emerges for precious metals industrial use
Silver Institute predicts an increase in global demand for silver due to its industrial use in the production of solar panels (photovoltaic) and as a catalyst for the chemical production of ethylene oxide. In addition, the metal is used in other types of industry as well. Will silver advance?
According to the Silver Institute, only these two uses of silver may increase global demand by 32% by 2020 compared to the level of 2015. Another factor in the growth of the consumption of this metal can become the active production of devices for cleaning the air and fighting smog in China. It should be noted that besides industry, silver is also used in jewelry manufacturing and for investment purposes. According to the GFMS, in 2016 there was recorded a negative balance of supply and demand for silver in the amount of minus 186 million ounces in the world market (maximum since 2008). Due to this, for the first time in 4 years its value increased by 14% overtaking gold which prices advanced 7% over the last year. In 2017, it is expected to have a decline in the world silver deficit up to minus 50-52 ounces. Nevertheless, many market participants expect that the average price of this precious metal may rise approximately by 20% in the current year compared to the level of 2016. The deficit of silver is covered at the expense of use of world stocks.
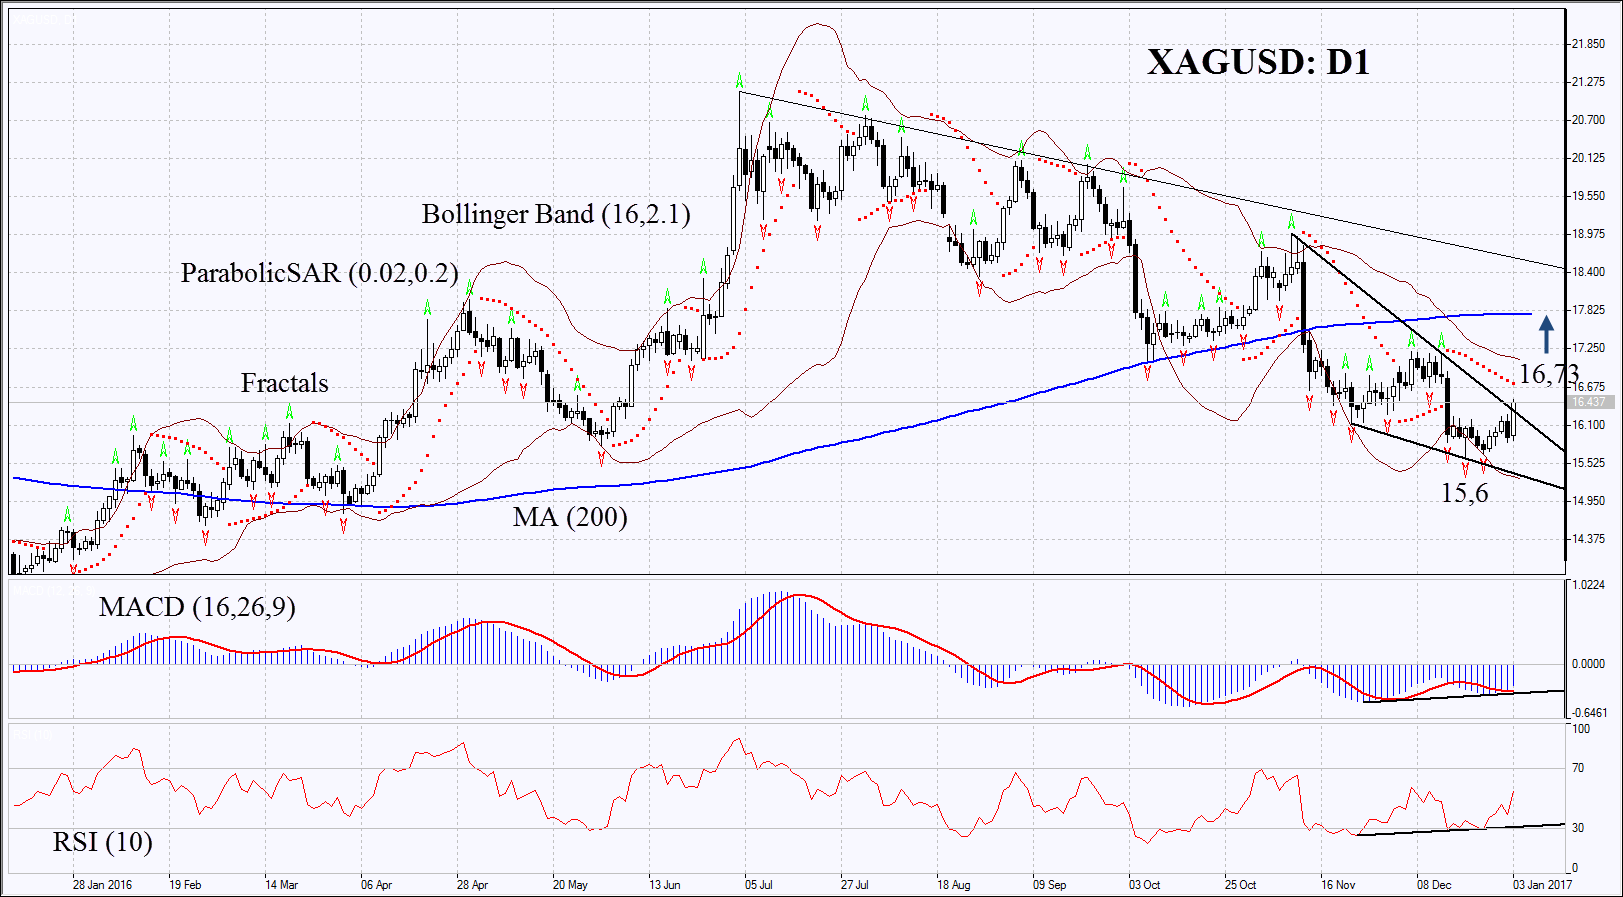
In the daily chart XAGUSD: D1 is trying to correct upwards from the 9-month low, but it keeps trending downwards. Accordingly, in order to open a buy position, the exchange rate should exceed its resistance level. Further price increase is possible in case of acceleration of global industrial growth and increase in demand for silver.
- Parabolic indicator gives a bullish signal.
- Bollinger bands have widened which indicates high volatility.
- RSI is below 50. It has formed positive divergence.
- MACD gives a bullish signal.
The bullish momentum may develop in case silver surpasses the resistance level of the downward trend and the Parabolic signal at 16, 73. The initial stop-loss may be placed below the last two fractal lows and the 9-month low at 15, 6. After opening the pending order we shall move the stop to the next fractal low following the Parabolic and Bollinger signals. Thus, we are changing the probable profit/loss ratio to the breakeven point. The most risk-averse traders may switch to the 4-hour chart after the trade and place there a stop-loss moving it in the direction of the trade. If the price meets the stop-loss level at 15, 6 without reaching the order at 16, 73, we recommend cancelling the position: the market sustains internal changes which were not taken into account.
Technical Analysis Summary
| Position | Buy |
| Buy stop | above 16,73 |
| Stop loss | below 15,6 |
- コースを取って、

【重要な注意事項】:
本レポートは、当社の親会社であるアイエフシーマーケットが作成したものの邦訳です。本レポートには、当社のサービスと商品についての情報を含みますが、お客様の投資目的、財務状況、資金力にかかわらず、情報の提供のみを目的とするものであり、金融商品の勧誘、取引の推奨、売買の提案等を意図したものではありません。 本レポートは、アイエフシーマーケットが信頼できると思われる情報にもとづき作成したものですが、次の点に十分ご留意ください。アイエフシーマーケットおよび当社は、本レポートが提供する情報、分析、予測、取引戦略等の正確性、確実性、完全性、安全性等について一切の保証をしません。アイエフシーマーケットおよび当社は、本レポートを参考にした投資行動が利益を生んだり損失を回避したりすることを保証または約束あるいは言外に暗示するものではありません。アイエフシーマーケットおよび当社は、本レポートに含まれる不確実性、不正確性、不完全性、誤謬、文章上の誤り等に起因して、お客様または第三者が損害(直接的か間接的かを問いません。)を被った場合でも、一切の責任を負いません。
