- マーケット分析
- トレーディング・ニュース
- Netflix Stock Analysis: Insider Selling, Technical Patterns…
Netflix Stock Analysis: Insider Selling, Technical Patterns…

Netflix stock analysis reveals insider selling, key chart patterns, and updated 2025 forecast. Should you buy NFLX now? Read before you trade.
Netflix: Insider Selling Raises Questions
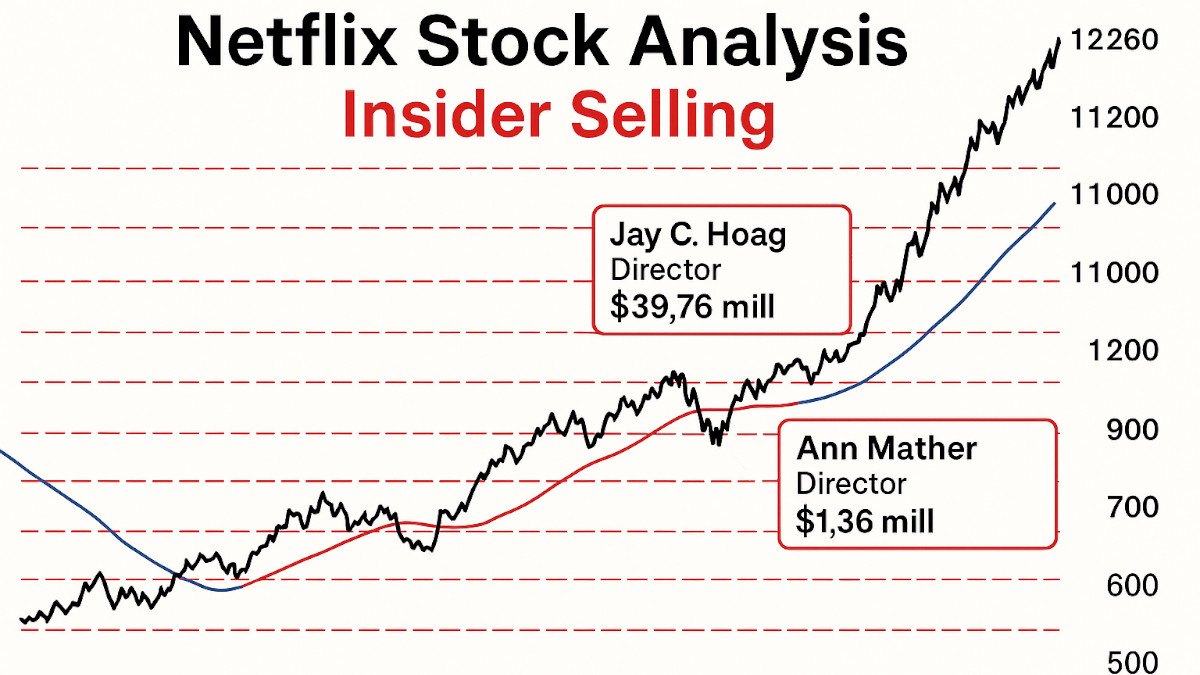
Multiple Netflix executives offloaded large amounts of stock on June 5, 2025:
- Jay Hoag, Director, sold 31,750 shares for $39.76 million.
- Ann Mather, Director, sold 1,090 shares for $1.36 million.
- Leslie J Kilgore, Director, sold 652 shares for $816,070.
These transactions were made under pre-scheduled Rule 10b5-1 trading plans, but the volume—particularly Hoag's—signals notable insider confidence loss, or at minimum, profit-taking at potentially overextended prices.
Warner Bros Discovery Breakup
While Netflix (NFLX) has distanced itself from legacy media in terms of growth, the Warner Bros Discovery breakup underscores ongoing distress in the media sector. The move, meant to separate the struggling cable business from streaming, is seen by analysts as "too little, too late."
Although sector peers are bleeding, Netflix’s clean balance sheet and singular focus on streaming keeps it relatively insulated—but broader weakness may still pressure valuation multiples.
NFLX Price Forecast & Chart Pattern: Time to Cool Off?
Netflix Chart Pattern Signals Overbought Territory
The Netflix chart pattern shows a parabolic rally in 2025, with almost no corrective pullback. After a strong run that pushed the stock past $1,250, several technical indicators suggest a potential correction:
- RSI levels are near 70 (overbought)
- No consolidation or basing pattern before recent highs
- Price action has broken away from moving averages
This is not a sustainable pattern. The stock needs a pullback to rebuild buying pressure.
NFLX Support and Resistance Levels
- Immediate resistance: $1,250–$1,265
- Key support zone: $1,163–$1,181
- Stronger demand zone: $1,070–$1,098
If selling accelerates, the $1,163–$1,181 level could offer the first rebound opportunity. A failure there may push it toward $1,070, where long-term buyers are likely to re-enter.
Should I Buy Netflix Stock Now?
With insider selling at the top and a parabolic move already baked in, this is not the time to chase.
Should I buy Netflix stock now? Only if it pulls back to a key support level with confirmation of renewed buying volume. Otherwise, risk is elevated.
Despite a positive long-term NFLX price forecast, near-term technicals and insider activity suggest pullback.
Conclusion: Wait for the Setup
This Netflix stock analysis shows a clear disconnect: bullish sentiment from analysts like DBS (raising their target to $1,416), but insider selling into strength. Combined with sector turmoil from the media sector breakup trend, it's best to wait for price to come to you.
Use the NFLX support and resistance zones to plan entries. The best trades are patient.


