- マーケット分析
- テクニカル分析
GBP/USD テクニカル分析 - GBP/USD 取引:2019-06-05
The United States president supported the exit of the UK from the EU
US President Donald Trump said the UK would benefit from Brexit. Will the British pound quotations increase?
On June 3-5 Donald Trump is in the UK on a state visit. He met with Prime Minister Theresa May, who will leave her post on June 7. The American president said that he would like to see as her follower on the post the representative of the conservative party Boris Johnson, a famous supporter of Brexit. Recall that the exit of the UK from the European Union was postponed and is now scheduled for October 31, 2019. Donald Trump advised Boris Johnson to arrange Brexit in the most rigid scenario, which implies a refusal to pay to the European budget. The American president also spoke about the possibility of expanding mutual trade between the US and the UK and signing a new trade agreement between the two countries after Brexit. Important macroeconomic data for April will be published in UK on June 10, which may affect the pound rate (GDP, industrial production and construction, trade balance and other).
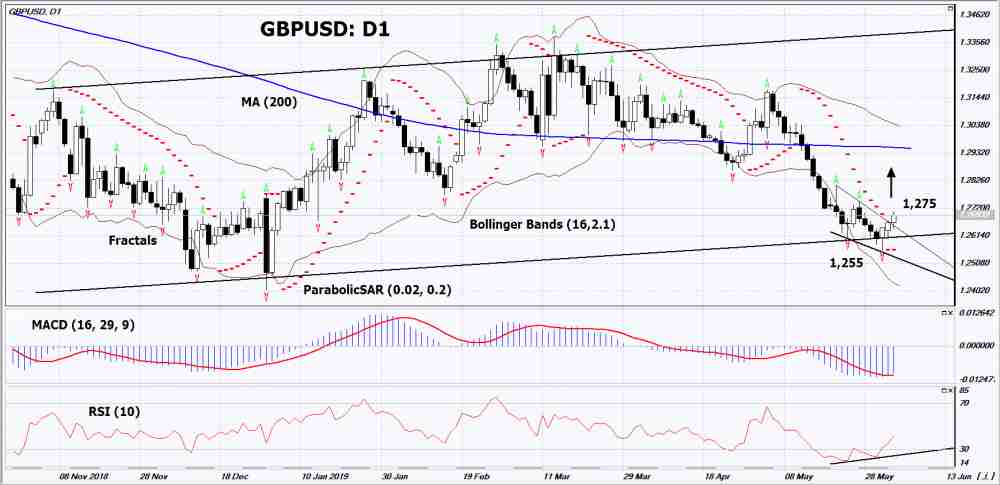
On the daily timeframe GBPUSD: D1 adjusted up from a 5-month low. Various technical analysis indicators have generated an uptrend signals. Further growth of quotations is possible in case of publication of positive macroeconomic data and the signing of a trade agreement between the United States and the United Kingdom.
- The Parabolic indicator shows an uptrend signal.
- The Bolinger bands widened, indicating high volatility.
- The RSI indicator is below 50. It has formed a divergence to the increase.
- The MACD indicator gives a bullish signal.
The bullish momentum may develop in case if GBPUSD exceeds its last higher fractal: 1,275. This level may serve as an entry point. The initial stop loss may be placed below the 5-month minimum, the Parabolic signal and the last lower fractal: 1.255. After opening the pending order, we shall move the stop to the next fractal low following the Bollinger and Parabolic signals. Thus, we are changing the potential profit/loss to the breakeven point. More risk-averse traders may switch to the 4-hour chart after the trade and place a stop loss moving it in the direction of the trade. If the price meets the stop level (1,255) without reaching the order (1,275), we recommend to cancel the order: the market sustains internal changes that were not taken into account.
Technical Analysis Summary
| Position | Buy |
| Buy stop | Above 1,275 |
| Stop loss | Below 1,255 |
- コースを取って、

【重要な注意事項】:
本レポートは、当社の親会社であるアイエフシーマーケットが作成したものの邦訳です。本レポートには、当社のサービスと商品についての情報を含みますが、お客様の投資目的、財務状況、資金力にかかわらず、情報の提供のみを目的とするものであり、金融商品の勧誘、取引の推奨、売買の提案等を意図したものではありません。 本レポートは、アイエフシーマーケットが信頼できると思われる情報にもとづき作成したものですが、次の点に十分ご留意ください。アイエフシーマーケットおよび当社は、本レポートが提供する情報、分析、予測、取引戦略等の正確性、確実性、完全性、安全性等について一切の保証をしません。アイエフシーマーケットおよび当社は、本レポートを参考にした投資行動が利益を生んだり損失を回避したりすることを保証または約束あるいは言外に暗示するものではありません。アイエフシーマーケットおよび当社は、本レポートに含まれる不確実性、不正確性、不完全性、誤謬、文章上の誤り等に起因して、お客様または第三者が損害(直接的か間接的かを問いません。)を被った場合でも、一切の責任を負いません。
